
The paper chart, still the best?
It’s true that I don’t navigate on paper charts anymore, but I appreciate them and use their electronic equivalent more than ever. One reason is what I learned last January while preparing for a TrawlerFest seminar called “Soup to Nuts Navigation” (which I’m reformulating right now for the new Cruising Boat Expo here in Essex, CT). The other is having just run up from North Carolina — including the entire New Jersey ICW, which can’t fit much more boat than Gizmo — with just about every chart type and brand in view. I think we would have had more trouble than we did because my mate and I learned navigation starting with paper charts and we referenced the equivalent heavily…
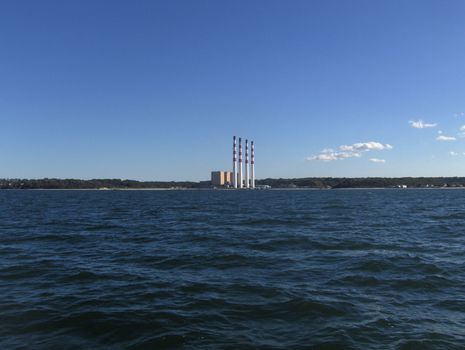
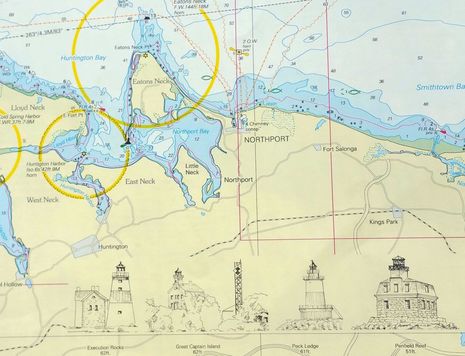
I have many examples of how vector charts — which are standard on chart plotters (or at least used to be) — sometimes fail to convey important navigation information as well as paper charts. But this entry will be first in a series as it’s completely focused on those power plant stacks above, which may well be the most prominent nav aid on the whole East Coast, even though they’re not an official nav aid. They’re 610 feet high, well lit at night, and absolutely unmistakable. In fact, the boater who took this picture revels in how useful the stacks are for non-GPS navigation.
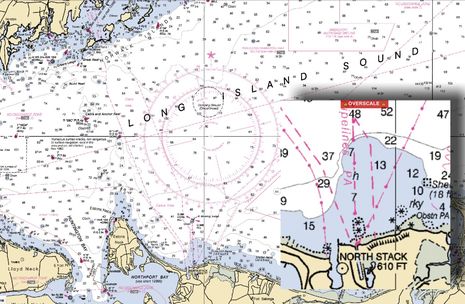 But to be useful, a non official mark like the stacks has to be charted. And in this case it should be on large area (small scale) charts because it can be seen from great distances (over 40 miles if you consult a Distance to Horizon table). If you click bigger the 1:80,000 scale Western Long Island Sound chart above, you’ll see that the NOAA cartographer did a pretty nice job. The inset also tells the story of how efficiently he or she used a very small section of paper. “North Stack 610” implies that there are more than one of these giants — so now you can confirm the chart position of what you’re seeing from afar — and the clean target symbol gives you a precise spot to lay down a bearing.
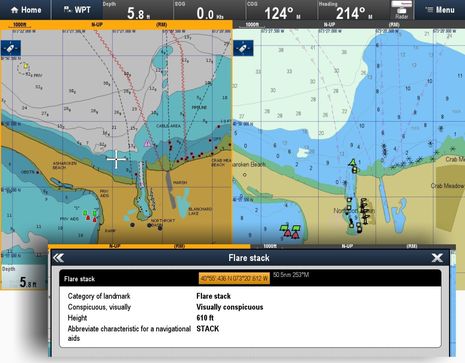
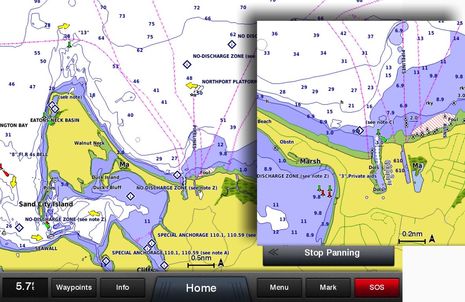 So, how did that useful information get translated into vectors charts? Badly! And badly by every vector chart maker including NOAA. The main screen above is a Garmin 8212 showing BlueChart g2 Vision cartography set to the “Normal” level of detail. I started at a zoom level roughly equivalent to the 1:80,000 paper chart above and zoomed all the way in to here without seeing any trace of the stacks. It was only at next zoom in, inset above, when they showed up. If you didn’t already know that this major landmark is just east of Northport, LI, you’d have a hard time finding it on the chart!
 The story was nearly the same on the Raymarine gS12, here showing Navionics+ on the left and Ray’s own Lighthouse vector (derived from NOAA ENCs) on the right. Each chart is set to normal viewing mode and then zoomed in until I could make out the symbols representing the four big stacks. Being vector charts — i.e. a database of geopositioned info that’s assembled into an image on the fly — you can drill down for data that can’t be presented well on the chart graphic. In this case that is Navionics clearly detailing one of the stacks (based on NOAA info). Let’s note, though, that Raymarine also offers completely free NOAA raster charts that are the digital equivalent of the paper charts, and their chart store has growing choices for raster/paper outside the U.S.
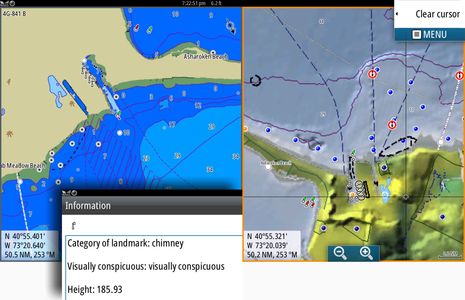 Here’s the Simrad NSS16 evo2 with Jeppesen C-map Max-N+ (2014 version) on the left and Navico’s own Insight chart on the right, again both zoomed in to just where I could clearly make out the stacks. In most places and situations Insight is my least favorite vector format, but the four target symbols did start to look like something significant a couple of zoom levels out. I put the C-Map in “Head Up” orientation to show how well vector charts do this — the numbers and text turn to stay right side up — but was surprised to see “Visually conspicuous chimney” listed as 185.93 somethings high. It should be in feet, as I’ve set the NSS16 to that measure, or at least it should say meters if it can’t make the conversion. But then C-map Max-N+ 2015 will have a complete raster chart layer even outside the U.S., very similar to the C-Map 4D Max+ chart packages now available for Raymarine plotters (plus some Standard Horizon and Humminbird models). At least the N+ rasters will be “dynamic” which means that vector style nav aid data can be drilled into from the raster layer. Sounds good to me! (By the way, Navico already offers two types of U.S. raster/paper charts, though none for free, plus others in their GoFree Shop.)
 Finally, here’s the Furuno TZT showing NOAA based raster charts in two windows. After all, Furuno trailblazed raster/paper charts on the first NavNet 3D system way back when and still do it very well. But I did put the left hand chart window Head Up to illustrate the challenge of raster charts in that mode. I also wasn’t pleased with the big jump in chart scale I experienced as I zoomed in, but that’s a NOAA oddity that may be part of the problem all the vector chart makers had with the stacks. In most of the U.S. there is 1:40,000 scale chart coverage for most everywhere there is 1:80,000. But in this part of Long Island Sound the jump is to 1:20,000.
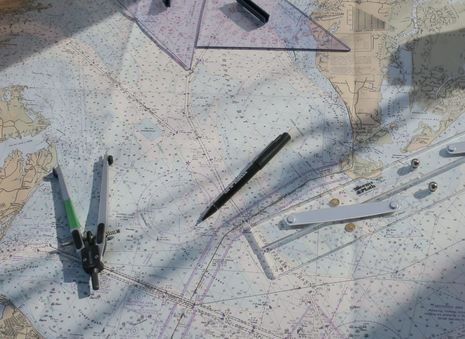
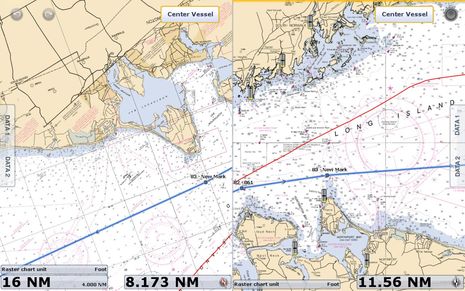
 Both of the raster/paper scales are shown in this collage, but its main purpose is to show how a navigator might use the stacks with a pencil and parallel rules or with a program that supports traditional navigation like Coast Explorer. I could plot a bearing line anywhere I can see a stack over my compass and thus derive a Line of Position. But in this case I laid an RBL (range and bearing line) right through all four stacks so I even need to use the compass. When they line up, I’m somewhere on that line, and the stacks bear 181 degrees magnetic. I could even check my compass while there.
 It was heartening to see that NV Charts came up with their own conspicuous symbol and “4 Chimney conspic” text to identify the stacks on the 1:100,000 scale page of their chart book (which includes a CD of matching raster charts and an app I’ve tested). Even better are the line drawings of major lighthouses in the area, a sharp old-time cartography aid that I’m not sure NOAA ever got around to. It’s nice to have help with visual confirmation when you come across marks like this, especially in the fog, and even if GPS is showing right where you are anywhere.
But GPS could fail, right? Actually, it hardly ever does, which is probably the main reason all those vector charts can be so poor at charting a major landmark like the Northport Stacks without much complaint. Admittedly, vector charting has only evolved for about thirty years — while paper cartography (or sheep skin) has nearly a millenium under its belt — but I want better. I’ll have lots more examples of what to look out for in my seminar, but this Cruising Boat Expo is looking like an enjoyable visit for most anyone who likes sail or power cruising. Essex Island Marina is such a peaceful place.
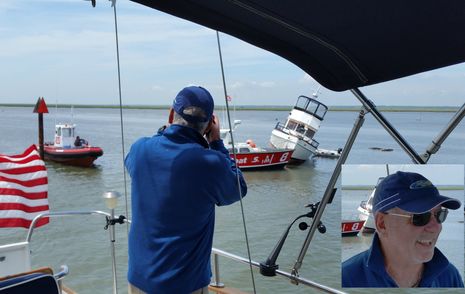
I’m closing with a very recent example of when navigation goes awry, but my real purpose is to embarrass my recent mate Peter Swanson, who also talked me into came up with the great “Soup to Nuts Navigation” concept. We don’t know how these cruisers went aground on the wrong side of the nav aid — probably a moment of inattention like we’ve all experienced — but we do know that at least they were far from an audience aside from the comforting TowBoat U.S. team. That is until Gizmo comes chugging around the bend with two boating reporters sporting cameras and a variety of social media devices! Yes, we were excited to find such a photogenic (and hopefully harmless) accident in progress, but we swore to wipe the grins off our faces when we were in sight. I was first to Instagram/Tweet/FaceBook it (I’m a dite embarrassed, too), but Peter really reported it.


Come to think of it, it was also Peter Swanson who put together this enjoyable and relevant debate on the value of actual paper charts:
http://www.passagemaker.com/articles/trawler-news/litho-chart-debate/
I stand by the notion that there are many ways to navigate safely, but also the notion that a shade of paranoia is a good thing 😉
I’m with you Ben. Got tired of navaids in Nantucket Sound dissappearing with zoom level and vector charts. Raster NOAA is my preference.
One of the things that I’ve noticed in the difference between mariners that where trained on paper charts vs electronic is that those trained on paper charts tended to have a better idea where they are than those using electronic charts.
The same issue is found with those that use GPS navigation in their cars. Using the electronics shorts circuits the brain a bit and impedes the brain to make a mental map of the area. (ref: http://www.bostonglobe.com/ideas/2013/08/17/our-brains-pay-price-for-gps/d2Tnvo4hiWjuybid5UhQVO/story.html )
Personally, I like having a small scale paper chart of the area I am cruising with electronics for the detailed areas.
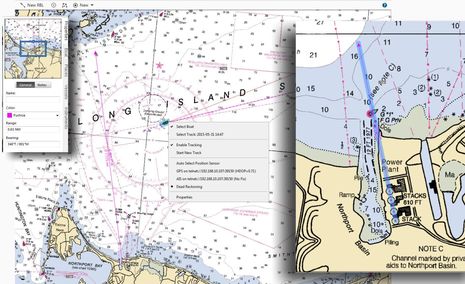
As desired by the article, the Fugawi Aboard includes the stacks at smaller scales. See the screenshots below using the Fugawi Aboard
-
Navico version on a compatible Simrad plotter:
http://www.fugawi.com/uploads/ckeditor/pictures/5571f5a262657402bbd70000/content_image_1_.png
http://www.fugawi.com/uploads/ckeditor/pictures/5571f5a262657402bbd80000/content_image_2_.png
http://www.fugawi.com/uploads/ckeditor/pictures/5571f5a262657402bbd90000/content_image_3_.png
Also unlike what is mentioned in the article about Furuno jumping from 1:80,000 to 1:20,000 and skipping the intermediate 1:40,000 scale when displaying the NOAA raster charts, the Fugawi Aboard chart shows the stacks at all three scales.
Thanks, Fugawi. I didn’t emphasize it enough but in fact I often use Fugawi Aboard U.S. raster charts on the Simrad system as well Raymarine Lighthouse rasters (which I believe Fugawi helped with). They are both very useful, though the Raymarine display seems a little sharper.
As for the 1:40,000 scale, this is a special case. It’s unusual but there is no regular 1:40 rectangular North up chart at that scale for this area. But there is a small craft chart at 1:40,000. In most cases it’s OK to omit small craft charts from a raster portfolio because they’re redundant and they were also confusing when older charting progams zoomed into their often odd orientation (done by NOAA to fit their booklet format).
But now I see that Fugawi has included the small craft raster charts (maybe just the non redundant scales?) but adjusted their orientation so they act normal no matter if the Simrad is in North Up or Heading Up mode. Well done!
Hello Ben,
thanks for your reviews and are much appreciated from the East Coat of South Africa.
Please could you or the group help us on HDS9 GEN3 which is GEO BLOCKED from 30degWest to 180deg West, and getting it unlocked.
My nephew visiting the US, purchased the instrument, only to find out that it does not work outside of the US regions.
How does Lowrance release that unblock on the HDS unit. I believe that if you sail to Australia and west, that unit goes in limp mode?
Your feedback is appreciated in this instance.
Many thanks
Jean-Francois
to quote Andy Grove, former chairman of Intel, “only the paranoid survive”
So Ben,
You’ve gone to and from NC with a boat load of stuff. This report barely touches the surface. How about an update on all those MFDs and Radars…….
Cheers
Don