
Raymarine LightHouse II, the chart goodness
A demo look at the new LightHouse Charts got me excited last fall, and I feel more so now that I’ve cruised around with them. U.S. boaters who own Raymarine a-, c-, e-, or gS-Series multifunction displays will find that both types of reprocessed free NOAA charts install fairly easily, look good and zoom/pan quickly. And though no LightHouse charts for waters beyond the U.S. have been announced, Raymarine clearly has the ability to produce them or permit third party cartographers like NV-Charts to do it themselves. Finally, Raymarine’s U.S. plotter models should hopefully cost a little less with free charts, and Navionics has perhaps been motivated to up its game. (Whatever the motivation, significant new Navionics features are right around the corner.)
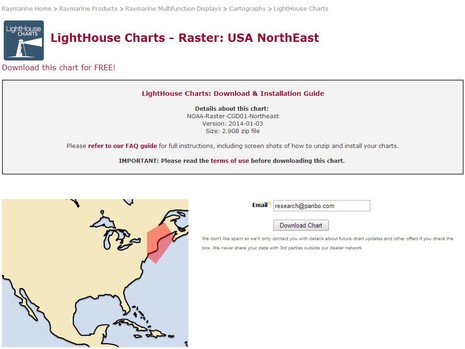
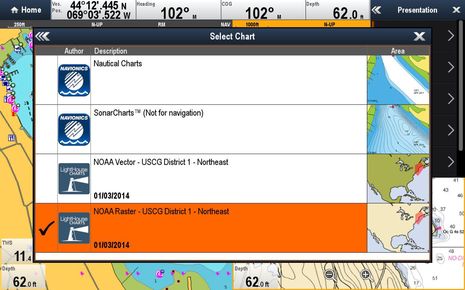
The most possible installation snag probably involves downloading and managing the large files you’ll find in the online LightHouse Chart libraries. The example above is fairly extreme — a 2.9 GB file containing all the paper-like raster charts for the complex northeast coast — but even the more efficient vector format for the same area is a 624 MB file. Whatever Raymarine does to make NOAA’s digital files work well on their displays is fattening, and you’ll need a good broadband connection for these downloads. However, if you’ve ever moved video files around, this is child’s play. Plus the Class 10 or better microSDHC cards that Ray recommends have gotten inexpensive, as in $13 for a 16GB model that would hold the entire US East raster and vector portfolio.
One note I would add to Ray’s well-done LightHouse Chart install instructions (PDF) is that problems unzipping the big files to a memory card can sometimes be solved by first unzipping them to your hard drive and then moving the unzipped files to the card (worked for me :-). Remember that your Raymarine MFD must be updated to LightHouse II software (aka v9.40) before it will display the new charts (it’s a 676 MB download but will fit on that same 16GB card). And note that owners of Mercury Zeus, Axius and Outboard Joy Stick systems with Raymarine autopilots are advised to wait for the next software revision.
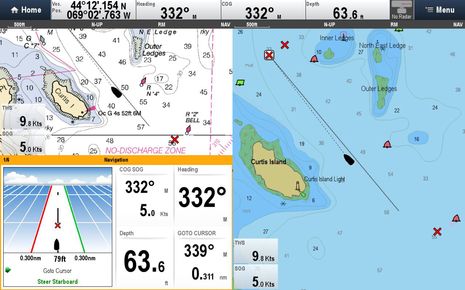
Installing the update and creating a LightHouse chart card was easy for me, and now I have the new charts running on both the e127 MFD model I tested all last season on Gizmo and an all-touch a77 that will become part of the boat’s glassy 2014 configuration. The a77 only has one micro SD slot, so it can’t run the LightHouse charts alongside Navionics when used by itself, but when networked with the e127 all charts are available on both displays (as in top screen), and I don’t detect any lag if a card I’m panning is in the other machine. In fact, all three formats are darn fast. I was a little disturbed not to see the Curtis Island light on the LightHouse vector chart above, but that turned out to be largely a user error…
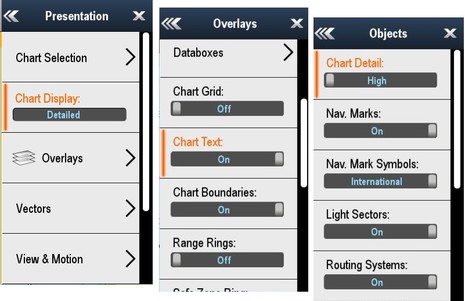 Like all vector charts, you can control how the LightHouse vectors look to some degree, and you should be careful about how you use those controls. The Curtis Island light is mistakingly categorized as a “Land Feature” when it’s really a “Nav. Mark” but frankly, I didn’t realize that I had the Chart Display set to “Simple” instead of the “Detailed” or “Extra Detailed” that looks right to me. Note the redesigned and reorganized menus in LightHouse II, which look good, I think, though I do wish they extended further down the screen when possible (scrolling is mandatory on the a77 and reasonably easy with just touch, but it seems so unnecessary on the 12-inch screen).
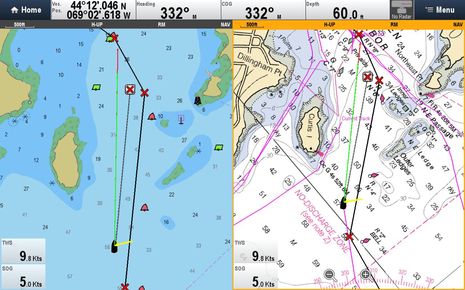
But I digress, and I will be writing a second entry about other LightHouse II features, anyway. Check out the LH vector chart with better settings above. I find it quite readable. Of course, the raster charts — which are like fixed scans while the vector images are assembled on the fly from a database — can’t be changed at all. The raster format is comforting because you’ll always see whatever is on the equivalent paper chart, but can also be discomforting when, say, you make your chart window head up while going south. I didn’t illustrate it here, but Raymarine chart windows are independent in that way so you can have raster charts North Up with a Head Up LightHouse vector or Navionics chart in the other window. (You can not have more than two chart windows, but you can have one or two extra windows of data — like above — or radar, sonar, video, etc.).
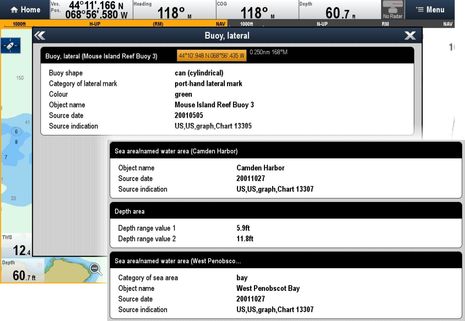 Any vector chart database should be able to divulge detail on chart objects and LightHouse is no different. But this is where I found the all-touch a77 harder to use than the cursor joystick and click knob on the e127. I also think that some other developers have done a better job of deciphering obtuse NOAA lingo (like Rose Point with Coastal Explorer) and I wish that Raymarine listed the edition/update date of each chart as well as those object source dates (which often aren’t relevant). It’s unclear, incidentally, how frequently Ray will update the online LightHouse libraries, though I understand that quarterly is a possibility.
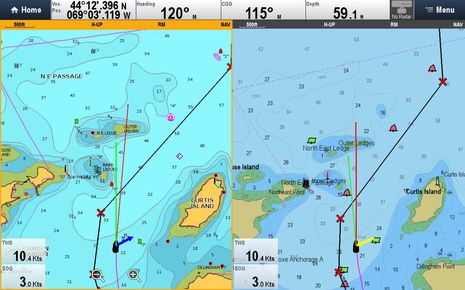
So how does LightHouse vector compare with Navionics? Well, it’s hard to compare, as Navionics has display settings like 3D and Easy View that LH vector doesn’t — not to mention Community Edits and marina data overlays, and much more to come. But that is Navionics+ at left above with much the same settings as the LightHouse at right. What do you think? And will it make a difference when the Navionics app on an iPad or similar device can easily put fresh chart data (and active routes) on your Raymarine MFD, and also pass your auto collected soundings back to Navionics to improve Sonar Charts?
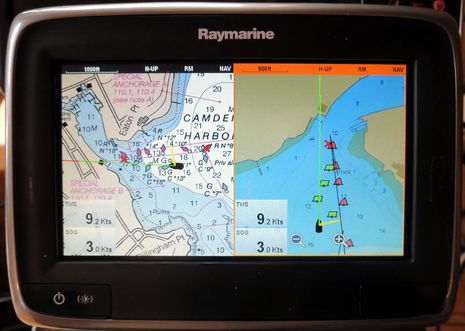
The chart possibilities for Raymarine users has improved quite a bit, and they’re slated to improve even more. Plaudits to the developers involved, and I’ll close with a photo of the a77 showing both LightHouse chart types. Note how the little 7-inch screen is almost all chart because of the DataBar Auto-hide feature, illustrated here. More LightHouse II testing to come.


Hey Ben did you know that the new Lighthouse Charts are available on the DragonFly too? They too got a new software update.
http://www.raymarine.com/dragonfly/
Ben, it seems pretty clear that the readability of the Lighthouse Chart doesnt stand up to the Navionics. Take a look at the daymarker at the Northeast Point passage. The type covers the critical gap between the markers. If I was looking at the Lighthouse version I wouldnt be inclined to try the passage but as we know it is pretty safe as long as you really know where you are. Who know what else is covered by type.
Thanks, Allan, but it was dumb of me to suggest making a judgement based on a screenshot. That LightHouse clutter around Northeast Point goes away if you change zoom level, change course, change chart orientation, or change the chart detail or overlay text settings in the menus further above.
It’s a lesson, I guess, in how dynamic smart (vector) charts are. And the screen where you can see the raster chart of N E Passage shows what cartography looks like when a human draws it, even if raster charts are as dumb as a sheet of paper 😉
On the other hand, I think NOAA made a mistake when they turned Northeast Pt into an island. I even photographed both sides at high tide trying to persuade them that it’s more isthmus than covering bar, but they stuck with their thermal photography technology.
Incidentally, I meant to mention that I wasn’t actually cruising around the bay. Gizmo is still under shrink wrap and surrounded by ice drifts now getting rained on. But I’ve got a neat simulator set up in my lab that I’ll detail in the next LightHouse entry.
Thanks, CME, I did not realize that the DragonFly also got a LightHouse II style update. But it reminds me that the DragonFlys — there’s now a 7-inch version too — run an operating system that’s purportedly very close to what’s in the a, c, e, and gS series, even if the interface is quite different.
Raymarine seems impressively disciplined in this regard. I’m not sure that any other manufacturer currently has such a unified code base. Which is why new features generally apply to all MFDs (DragonFlys the major exception because of more limited hardware and different marketing goal, but apparently still running the same chart engine and more.)
I have just recently started using Garmin BlueCharts on an iPhone in addition to Raymarine / Navonics. I am writing this anchored in Green Turtle (Bahamas). The BlueCharts are astonishingly better than Navonics…. far far more detailed and accurate. Some examples in just the last three days of crusing:
– the pass at memory rock looks not doable on Navonics yet easily doable with great detail on BlueChart. The bluechRt depths very closely matched our sounder readings.
-the reef in the middle of crab Cay anchorage is shown on Navonics as deep ( but when zoomed in max it shows a 5′ sounding). Blue chart has it as a red hashed Don’t Go area. Its super easy to hit and looks like a keel ripper.
– enterence to green turtle is clearly charted in detail on bluechart and matched our soundings closely. Navonics is not nearly as clear or useful.
I have the feeling ill have lots more examples in another week of crusing. My next chart plotter will have to have bluechart support or there is no way ill buy it.
Does b&g support bluechart ?
If so , as well as garmin ?
Thanks, Rob, but the Bahamas have what’s possibly the most confusing charting situation in the world. There is little official data to license but there are several “mom & pop” survey operations that have done great work and also some companies like Navionics and NV-Charts have apparently done their own surveying in some areas.
Garmin licenses Explorer Chart data for at least some of the Bahamas, apparently through Jeppesen C-Map, which holds the master license. But the Explorer folks don’t seem completely pleased with how Garmin is using their data:
http://chatter.explorercharts.com/?page_id=8936
At any rate, you should see data detail similar to what you’re seeing in BlueChart on C-Map charts which can run on Navico B&G plotters, as well is in apps like Plan2Nav. (Though they won’t look the same because data presentation is a different subject.)
But please do not assume that the better charting you’re seeing around Green Turtle applies elsewhere in the Bahamas, let alone outside the Bahamas. It just doesn’t work that way. Explorer is not the only good data source and, as best I can tell, no single private survey operation has covered the entire Bahamas.
Furuno and MaxSea now support both C-Map and Navionics data display and they showed me once why it’s good to have both in Bahamas:
https://panbo.com/archives/2010/06/furuno_maxsea_timezero_2010_valuable_dual_navionicsc-map_more.html
Fortunately, lots of MFDs now let you use more than one chart type, and it’s also easy to do with tablet apps.
Interesting. Another Bahamas chart maker, Wavey Line, seems to license data to every electronic chart company:
http://www.waveylinepublishing.com/charts/electronic-charts/
We have the same very bad experiences with Navionics in the Bahamas. Between Foul Cay and Guana Cay (south Elizabeth Harbour) Navionics shows 8 foot depth AND “Center line of Recommend route” through it. It is I fact a reef with maximum 3 feet at high water.
Talked to another cat owner who broke both his dagger boards pulling into a bay to anchor in bad weather and bad visibility after a long bad crossing, which was shown deep and as an anchorage in Navionics. It was filled with coral heads near surface.
Many other examples like this in The Bahamas. Navionics is often just plain wrong, not missing details.
North end of Elizabeth Harbour it shows a passage with plenty of water that showed breaking waves yesterday in just a small swell with no wind waves. Must be just inches deep at low water. There was a grounding there 4 days ago. The boat is a loss.
We have to use the Explorer Charts on paper to navigate I. the Bahamas.
So do I understand correctly that c-map charts for Bahamas are as good as Garmin on iPhone?
Will it work with my E80 Raymarine MFD?
Rob, your E80 uses Navionics chart cards, so if you want the Explorer data for the Bahamas you will need an app or PC charting program that can show Garmin or Jeppesen C-Map charts.
Interestingly, C-Map now makes two Bahamas chart portfolios. One is based on a mixture of Explorer and Wavey Line data, the other all Explorer. I have no idea which is best.
More Raymarine chart choices! Early next year owners of Ray Lighthouse II displays will be able to use C-MAP 4D cartography cards (C-Map’s highest level). This is particularly good news for Bahamas cruisers who prefer the Explorer data that C-Map has licensed over Navionics data.
http://www.boatingindustry.com/news/2014/11/17/raymarine-partners-with-jeppesen-to-provide-improved-customer-choice/