
MFD comparisons #2, mostly currents
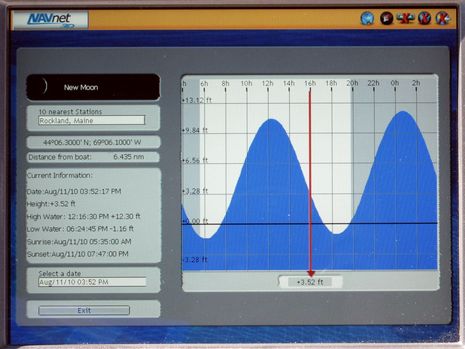
I sort of knew that “shootout” was a poor word choice — implying the certainty of corpses and so forth — and I’m officially dropping it from the Panbo title vocabulary; it’s too hard to be that certain! A glaring example was omitting Furuno tide graphs from the MFD tide “shootout”; I knew better, really, but somehow briefly lumped tides and currents into the POI info that’s so far missing from the NavNet 3D charts (but won’t be once Active Captain and C-Map data is supported). In fact, you just click and spin the RotoKey to Tide Graph, click again, and you get the nice screen seen above of the nearest prediction station. But it’s not perfect, and when it comes to current predictions, it looks like none of the MFDs are…
If you click on the Furuno screen above, you’ll see that yesterday’s midday High in Rockland was predicted as 12.3 feet, but the Garmin 7212, Raymarine E140 Wide, and Simrad NSE12 all had it at somewhere between 11.3 and 11.6 feet. In fact, the NN3D number doesn’t equate to its own graph; 12.3 — actually the am heights — appears to be a mistake. I was somewhat surprised to see slightly different predictions from all the machines, but the formula is complex, with numerous harmonic constituents, and besides we don’t need precise predictions even if the tides themselves really were that precise. That’s why I think it’s just noise to predict tides to seconds and 100ths of a foot, as Furuno does, (I even like how the Canadians round all tide and current predictions to five minute increments).
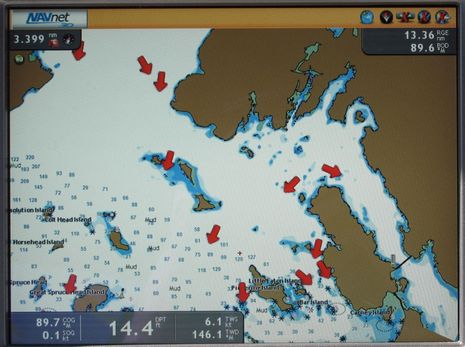
At any rate, things got dicier on all the MFDs when I started looking at Current predictions. I like the way NN3D can overlay current arrows for the numerous prediction stations in my region, but it can’t animate them over time or graph them. MaxSea Time Zero can animate current arrows, and will get current graphs eventually, I’m told, as may NN3D. (The screen shot below also illustrates the improved ENC/S57 display that came with the latest NN3D update, but also the fact that Furuno can’t provide data where NOAA hasn’t yet created it; there are no soundings in that blank area no matter how deep you zoom in, and I’m looking forward to trying Jeppesen C-Map vectors on the MFD12.)
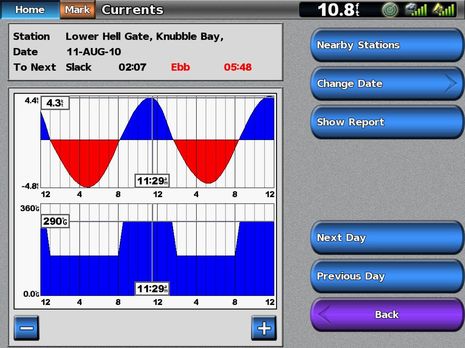
 Meanwhile, I was surprised to find that the Garmin 7212 apparently won’t predict any of those currents seen above, nor many others in my area, though it does a fine job graphing the data stations it does have, as seen below. You can view the data in text table form or, better yet, move the prediction line (seen at 11:29 below) across the graph with your finger tip. The Simrad NSE offers no currents at all {Wrong! see below}, as noted in the tide prediction comparison, while the Raymarine E Wide has a full selection of current stations with graphs and tables. However, Ray’s current table isn’t in chronological order, which is confusing (and unlike its tide table), and all the current predictions seem able to differ more than a little from the official data. The NOAA table, for instance, shows yesterday’s flood at Lower Hell Gate maxing at 3.4k at 11:11, while Garmin predicts it at 4.3k a few minutes later. That’s over 25% off, right?
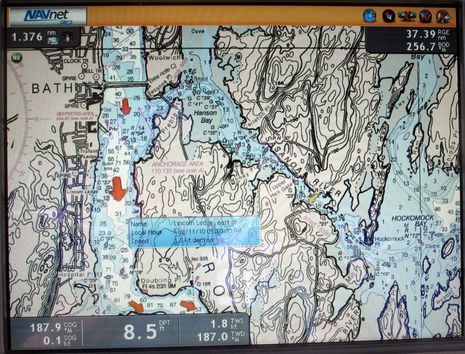
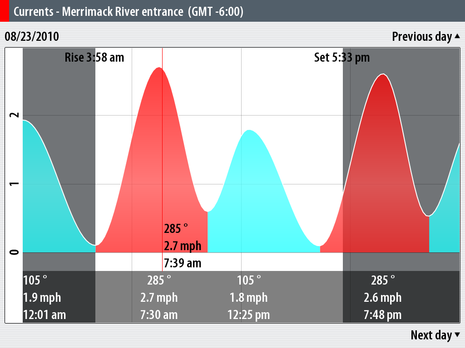
 By the time I finished looking at MFD current predictions last night, I thought the Furuno seemed capable of being most off, particularly comparing that 1.8k ebb calculation below to Garmin’s 3.7k and Raymarine’s 3.6k for the same time and station. And given NOAA’s official max ebb of 3.4k about 20 minutes earlier, NN3D is the most inaccurate in this case, but it seems like all these developers need to check their math and/or NOAA harmonics! Then again, I don’t think an experienced navigator ever expects current predictions to be very accurate. And I’ll leave you with a brag that thought and this particular chart always reminds me of. Back in my youth, I several times managed to sail the Sasanoa River — Hell Gates currents working for me — in the 35 foot schooner Vernon Langille without electronics or auxilary propulsion, beyond two sets of big ass oars, and often with much of the enormous cockpit filled with fire wood. I do believe I also had printed tide and current tables 😉
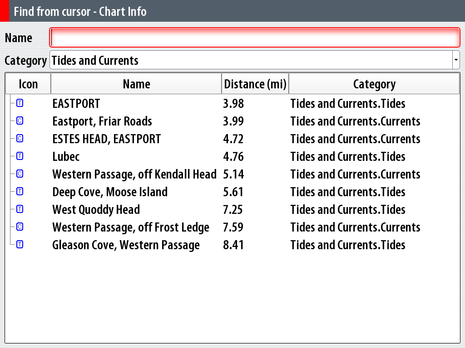
PS: The screens below illustrate the built-in NSE graphic current predictions I missed, plus how on-chart icons can be searched:


Coastal Explorer current predictions also vary from the NOAA online tables I checked, mainly high on velocity much like Garmin and Raymarine are.
There is no excuse for US calculations that don’t match US government tables. The only source for the harmonic constants is the government, the formulas are simple, and the data is mostly free (there is a small fee to get the secondary stations). The constants don’t change very much over the years but it should still be an annual task for the vendor’s software team to download the latest. Where you are seeing missing stations, my guess is that the vendor did not pay the small fee to get the official dump of the secondary station offset data.
Outside the US the story is not as black and white. Other countries sell their tide constants for real money. I can see a system vendor balking at the paperwork and cost. I can see a software engineer pointing out that similar constants are embedded within some of the open-source tide programs like X-Tide. Nobody really knows where such constants came from or how accurate they are.
Bottom line, you might be seeing somebody using constants pulled out of X-Tide or you might be seeing bad programming. Vendors should disclose where the data they use comes from and feel shameful if they are not using all the US data available, updated every year or two.
I would tend to agree, Craig, but this appears to be harder than it looks. I can hardly find a tide or current prediction I’ve looked up in the last couple of days that truly matches the NOAA published tables (not that the variances are very substantial in most cases). I’d be curious if others find the same, and am grateful NOAA puts all their data online now:
http://tidesandcurrents.noaa.gov/tides10/
http://tidesandcurrents.noaa.gov/currents10/
Ben …
The animated tide and current functionality is a product of G2 Vision. Not sure whether you were using G2 Vision charts of your area when you did your comparison. There are on chart arrows that show direction, speed, and period of the current data plus you can play the what if game with the data (i.e. future or past date/times)
http://i676.photobucket.com/albums/vv129/bluewaterpirate/Garmin%20700/AnimatedCurrent.jpg?t=1281636295
Here is screen shot from my Garmin 740 showing the current tidal arrow inforation.
http://i676.photobucket.com/albums/vv129/bluewaterpirate/Garmin%20740%20and%20SH%20GX2100%20Install/1680.jpg?t=1281637352
Tom
None of the calculations for tides and currents from NOAA are cut and dry. NOAA has their own logic to process the invalid data.
Most people that simplify the logic behind the system are only familiar with the processing of primary tide stations. The complexity of the currents and secondary stations processing can be summarized by how rare it is to find an application out there that does these calculations…let alone does it efficiently. Most programs only handle primary tide calculations.
Primary stations tend to be a bit more accurate. Secondary stations are based off these primary stations and often times the time offsets specified by NOAA will flip flop the flood or ebb with the slack or in extreme cases, the flood and the ebb. NOAA and every company out there have their own logic to handle this.
This is just one of the problems that happens with tides and currents calculations. There’s a multitude more.
Identifying the flooding and ebbing on a currents chart is often times rather difficult. Tides H/L are a 1D graph. Currents is a 2D graph represented by vectors and intensities. The vector direction will often not circle around the origin (or any consistent point for that matter) and sometimes will not even make it back to the origin.
If you don’t identify the proper min/maxes or you include phantom min/maxes (which is surprisingly easy to do), your secondary data based on this primary data will be worthless – identifying phantom min/maxes or identifying the incorrect min/max (using a phantom value instead of the real value) leads to a surprising amount of secondary station errors.
Often times, your rotary current stations will flood or ebb at a direction that is significantly different from the identified flood and ebb direction. The provided flood and ebb directions are a good suggestion but you’re not supposed to get caught up with it…they can be 10-15 degrees off from there.
Most companies that display the directions on these rotary stations display them pointing towards the flood and ebb directions even though as they are approaching a slack, they can be 1/2 intensity of the flood at an angle that is 90 degrees from the flood (as the current vector is shifting to or from the ebb). The slack logic on these stations is real fuzzy. Many secondary stations are based on these stations but the slacking intensity and direction on a secondary station prediction based on a primary rotary current station in open water is always wrong.
The equations provided by NOAA will let you plot in the 1D and 2D planes for the primary station but the equations have nothing to do with identifying flooding and ebbing (that’s trial and error). The identification of the flooding and ebbing is what allows the secondary stations to be properly plotted.
Ben – I think you might have chosen a better feature on which to compare the MFDs. This is an area fraught with compromise and estimation.
I grew up racing in San Francisco where the race course is frequently dictated more by the current than the wind shift (forget the header, get to the beach). I understand how bottom contours create venturis and why the same tidal difference results in very different currents. And how other seasonal factors (like the Sierra snow melt) can affect local currents. Currents are much more tricky to forecast than tides. So let’s give the MFDs a pass on current for the moment (no pun intended for those in the Tuamotus).
I reviewed the Wikipedia page on Tidal Theory and it quickly became a very complex subject. At the risk of sacraficing what little credibility I may have, can anyone explain this stuff in layman’s terms? There are two things that I do not understand:
1) Why do some places have two tides a day (diurnal) and some only one (semi-diurnal)?
2) Why do places with similar latitudes and even longitudes, have radically different tides? My most recent case is point is the north side of Panama (less than 1′) versus the southern side (more than 10′)?
Along the Maine coast I can see tidal height by simply looking around. I use an MFD (and iPhone) to determine if fast current will be flowing into a river or out of it. I charted a path just last week based upon an MFD current chart. I ended up making the wrong routing decision because my MFD had the flood/ebb thing backward. I should have checked the iPhone as well.
I agree that tide and current predictions will never be accurate to the number of digits that programs offer up. Russ explains why just above. However, I also believe that anyone selling tide programs (even inside an MFD) should at least use coefficients from a known source and test their math results against known cases. NOAA will even send you the actual FORTRAN program that calculates the tide books. The Canadians have updated that program and will happily send you their version as well. These are short programs (just a bunch of trig functions added up). It isn’t that hard to get it right if you care. I agree the secondary current stations are a little confusing but no more confusing than the hand calculations we did using printed books for years. The current arrows that some programs show on charts are usually only correct near max current. However, they are always pretty and I don’t mind the illusionary accuracy near slack.
Ben …..
Here are some better displays of the animated tidal station and arrow functionality.
Garmin 740 …..
Picture 1
Picture 2
Data that can be pulled from the chart tidal station
Picture 3
Picture 4
Annimated tidal arrows and associated data
Picture 5
Picture 6
Picture 7
Picture 8
Picture 9
Picture 10
Thanks for taking the time to do these unit functionality comparisons.
Tom
Russ, I plan to compare lots of MFD features, and figured tides/currents would be an easy place to start. The interesting nuances of predicting them shouldn’t have anything to do with it; as far as I know nobody is collecting harmonic constituents except NOAA and other HOs. At least for the U.S., the MFDs should be showing the same predictions, and the only comparison should be how they well they display them. I’m really surprised to find data discrepancies, even small ones, and missing stations.
I learned a lot about tides and currents when I was editing Reed’s Almanacs, and someday we should discuss. It’s no embarrassment not to understand the mechanics; they are very complex. Excellent book on the subject: Beyond the Moon, by James McCully
Ben, it seems to me that there is lots of room for discussion on the relative accuracy of tide/current predictions – but in terms of reviewing competing MFD’s, I’m much more interested in how well the different manufacturers design their software to display the data. Burying the data several layers deep in a menu, or cluttering the display by showing headings to the tenth of a degree and ranges to the 1000th of a NM (as shown in some of the screen shots) are just some of the poor choices made by software/system designers. There may be an excuse for inconsistent data; there’s no excuse for poor design.
I’ll second that Grant! I’ve voiced my opinion to Furuno many times over the last two years about the clutter created by useless “prescision”. Just a few examples:
– Coordinates to .0001 of a minute.
– Tide depth to .01 of a foot (see picture at top of this article)
– Distances to .0001 of a NM
– Headings to .1 of a degree (course to steer, COG, HDG, etc.)
– Speed to .01 of a knot (Furuno is not the racers instrument)
– Temperatures to .01 of a degree
– Humidity to .1%
– Wind speed to .1 of a kt
– Wind direction to .1 of a degree
– etc., etc., etc.
Furuno could drop one decimal off every display on the MFD, and in MSTZ just for starters. It’s useless clutter and the constant updating makes the displays all look very nervous, distracting from more important data.
If there is some industrial application that requires this accuracy then provide the means to set the display resolution.
Amen to that Russ. We’ve complained several times as well, I’m not sure how the NN3D software ever got past any real-world testing from a useability standpoint. Some of the mistakes (I don’t know what else to call them) are almost embarrasing – data boxes sized too small to contain the data that’s supposed to fit in it? (see ETA box in photo).
(Never mind, I can’t figure out how to upload the photo off my desktop – anyhow, if you’ve used the system, you know what I mean.)
Or the Databox #4 that overlaps and blocks out part of the Wind/Weather display? Furuno’s “answer” to the latter problem was to make the databox “semi-transparent” – give me a break! I’ve got an outstanding list of over 20 issues that I’ve submitted in the first few months of using this system (Ben has a copy), and I’m afraid only a MAJOR redesign of the software is going to improve it significantly.
I agree with the NN3D comments and have a (humorous) one to add: the shutdown countdown. Much like with Garmin gear, when you hold the power button on the MFD you get a 3 second countdown for shutoff (so the unit doesn’t shut off immediately if you accidentally push the power button).
Given that the total countdown is 3 seconds you might expect the display to show 3…2…1…off. Instead it reads something like (I’m not on the boat at the moment): “Shutdown in 0m02s”.
Good thing I know there are zero minutes left!
Listen to these complaints … do you guys use the current feature on your MFD’s ? I think this was a great feature for Ben to compare, especially when the first 10 things we all might look for in an MFD have very little difference between the major MFD’s.
If you put aside the mathematics issues as discussed on this thread (not to marginalize a 25% difference, which I agreed is material), placing current information even 85% accurate at our finger tips is a very useful feature of an MFD especially in areas I have local knowledge to make a useful decision with the information.
How well the user interface makes it available to us, makes a big difference in using the feature. For example, I use it 10x more often since it became available on my chart plotter animations. I am a big fan of arrows appearing on the charts at each station across a wide map with depths labeled (e.g. our std MFD display), and animated as I skip forward and back in adjustable increments of time (on the classic e-series I often choose 1 hour). This capability allows me to perform a fast analysis across a space of 20 or more miles ahead helping me come up with an eta to my destination, as well as affecting my routing decisions (which are also affected by wind direction).
With all the things I need to do on a sailboat (as chief entertainment officer rather than navigator), my only real chance to check the current tables is before a trip and there is only so much I can memorize. Underway I don’t have any time to go through the paper current tables, not even station graphs (another method of displaying on an MFD)
Knowing the direction of the current and how it is changing over time in a minute or two, will get me to either take advantage of the currents (e.g. which usually = head to deeper water) or mitigate them (usually = shallow water or likely areas for eddy). Sometimes all you need is a ¼ mile change in your course to gain a big benefit.
In a way, I also feel better about myself as a navigator when I make the effort to do this, as opposed to a dunce when I screw up my arrival time by an hour. Having used the animation feature, not only would I look for it in my next MFD, its absence would prevent me from upgrading.
I wrote “knowing the direction of the current and how it is changing over time in a minute or two”, I meant to convey I can take in the animations and do the analysis in a minute or two.
Dan, Yes we DO use the current overlay, and I agree it can be very handy – unfortunatly, the Furuno product does NOT allow you to see anything other than the real-time current – there is no way to adjust or project the date/time to see what it might be doing in 2 hours, for example. I’m glad you’re hapy with the Raymarine product, but that was the point of my post – who does the best job of software design when it comes to ease of use, display clarity, and functionality? In this instance, and as pointed out in some of the other “complaints”, it’s clearly not Furuno.
Russ – I live in Jacksonville Fl and we generally have two tides per day that can be 2-6′ in range. Across the state Tampa only has one tide per day and does not have the range of our tides. There are about 50 major factors to calculating tide so it is very complex.
Taking a simplistic view – everything being equal, the sun and the moon only account for @ 8″ in tide change. The rest is mainly due to the shape of the basin. For example, Hatteras sticks way out into the ocean and Cape Canaveral sticks way out into the ocean. Mayport (Jacksonville) is almost in the center of this and the two land masses act somewhat like a funnel with Jacksonville being at the spout. While Tampa is on the Gulf of Mexico. There is only a small opening to get all of the water into and out of the Gulf. This dampens the tides and causes Tampa to have less tides and much smaller ones.
Wind, conflicting tides, friction, etc all play into determining the tides. There is an excellent book on tides written by James Greig McCully called “Beyond the Moon”. It does the best job of explaining the tides without getting too technical. It is actually a pretty good read.
(Note James if from Jacksonville but I do not know him nor have I met him)
Just becuase there are features you don’t use doesn’t make it useless. The world doesn’t revolve around one or two boaters. Russ mentions that he deosn’t understand temperature to .01 degree. Obviously Russ is not a fisherman, at least not a serious or good one.
This is an excellent discussion, and I agree with everything said. I am reminded of the fact, that where I live (Sarasota), that mother nature regularly renders whatever precision is available from the MDF’s regarding tides, and currents a mote point. A brisk wind out of the east, will create a low tide, that could be 50% lower, and cause an outgoing tidal current to double, and a west wind does the inverse. I suggest to my clients, that before they depart from dock, to check the tides to get a general idea of the both magnitude, and trends for the day (we can have up to 4 tides a day). As for currents, my concerns are mostly are they cranking, in or out, and will my 13 HP Yanmar make it through at all, or do I wait until slack tide. I just view the info as an interpretative aid to navigation, so the attorneys advise me, when I turn the unit on.
As for data access via the various menus, MDF developers need to remember that we all use about 20% of the capability 80% of the time, and these items, including tides/currents should be quickly, and intuitively accessible. Some MDF’s certainly do this, and some do not. I would suggest that ease of MDF use, is directly related to the MDF sales volume/market share.
DOH! I’m guilty of another mistake. The Simrad NSE does have some current predictions. But they are accessed via on-screen icons, not the Pages menu, and, like the Garmin, many Maine secondary stations are missing. Simrad also uses an unusual current graph that looks like a tide graph, but reads fine once you get used to it. It’s easy go forward, or backward, by day, but there’s no facility for searching nearby stations.
Russ, I just got the Furuno GP-33 in for testing and, interestingly, its decimal “precision” is different than NN3D:
COG and Bearings are in in whole degrees
Range to .01 nm
Position to .001 minutes lat/long
Speed is still to .1k, but I think that’s the right way to go.
The Gp-33 has a very bright and sharp screen, powered by “CAN bus”, and seems like a fine GPS overall…more to come.
In the meantime, Furuno has put up a demo video here:
http://www.furunousa.com/LearningCenter/Product-Guided-Tour-Videos.aspx
Arnie, The Airmar B17 High-Precision (water) Temperature Sensor — which Furuno was first to support, I think — only claims accuracy to ±0.3°C (0.17°F), so it’s hard to understand the value of temp expressed to .01 degrees no matter how good a fisherman you are:
http://airmartechnology.com/uploads/brochures/b17.pdf
Ben-
Virtually every sport fishing boat I fish on has the RD30 with the hp transducer. They also read to .01 degrees temp. It is NOT the actual temperature but the shifts that are most important.
I’ll agree that your typical cruiser or sailboat doesn’t need this type of reading, but a fisherman does. Manufacturers build products with 100’s of feature even though no one uses them all. But you,Russ and everyone else who posts here use some that others don’t.
Arnie,
Point taken on the temperature trends for fishing use – but the rest of the needless “precision” that Russ pointed out is still a valid concern. The RD30 is a great instrument, but the NN3D displays not only default to mind-numbing values, they are hard-coded so that the user cannot change them. Including “100’s of features” is great, but the defaults need to yield a useable display, and the rest of the “features” need to be easily configurable by the user. That is the basis of the design critique in mine, and I assume others, posts.
“Beyond the Moon” seems to be the book to get. Thanks for the referral.
Regarding precision, perhaps one of Ben’s comparisons of the MFDs will address how they all treat precision of various data elements.
It’s clear that one man’s clutter is another man’s critical data, at least with regard to water temp. Arnie, if it’s trend data you want, an up/down error with a time and/or threshold setting might actually be more useful. E.G., up/down arrow if change > .xx degrees during x.x minutes. That way when you see 82.04F, you don’t have to remember if the previous reading was 82.03, or 82.05.
I think Grant and I would prefer to just see 82F.
In any case, lots of good feedback here regarding the importance of UI for all the vendors.
If the Simrad works like the HDS, you can access the currents through a search using the Find > Chart Items and selecting currents out of the search list.
It does. Plus you can simply move the cursor over one of the “C” icons on the chart and press the Tick key, and hey presto you are presented immediately with the current prediction graph for that location.
I think Ben’s confusion must be because there is a tides page short-cut off the Pages key, but not one for currents.