
Is it true news that “NOAA wants to stop making NOAA charts”?
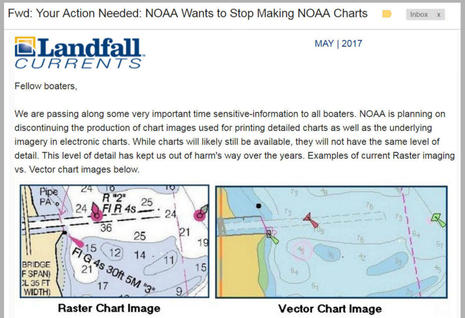 I’m a longtime fan of Landfall Navigation and I’m sure their intentions were good when they emailed this call to action Friday afternoon. But please don’t file a comment or call your congressman without looking deeper into the “news” that NOAA plans to discontinue all (paper-chart-like) raster files. In my read the end of rasters is only a far future possibility suggested in a recently published National Charting Plan that has some real meat (discussed below), and I’d be flabbergasted if it happened soon, or ever at the expense of important chart detail. Let’s judge NOAA on facts, not fearful conjecture…
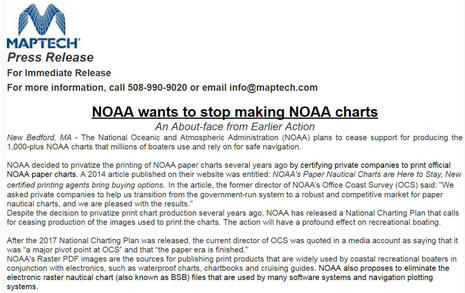
If you received the Landfall email, or read it here, you’ll see that the alarm is based on an included Maptech press release (which unfortunately is also published here as if it were actual reported news). I asked Maptech to explain the source of this “news” and while I may be a hardhead, I simply don’t get their answers. For instance, Maptech stands behind the lead claim that NOAA “plans to cease support for producing the 1,000-plus NOAA charts that millions of boaters use and rely on for safe navigation,” even though they acknowledge that their fears do not apply to NOAA’s ENC vector chart coverage of the same areas and also acknowledge that eliminating all RNC raster digital products is only mentioned in the “visions for the future” ending to the National Charting Plan.
Here is a statement from Maptech President Lee Estes following our conversation:
NOAA’s National Charting Plan contains a lot of useful proposals that we agree will help improve navigation in US waters and help ensure safety of life at sea. Upon initial review of the document, we became concerned regarding the section entitled:
VISION FOR THE FUTURE OF THE NAUTICAL CHARTING
The End of Raster Nautical Charts (Sunset of Paper Charts)
We decided to seek an explanation of this section with the specific question of how imminent and serious was NOAA’s intent to end the publication of the raster files used to create paper charts and electronic RNC files. In this process multiple staff from our office learned from personnel in a position of knowledge that there was intention at NOAA to wind down and end the NOAA paper and RNC programs starting in July of 2018 (the date when all large SOLAS ships will stop using paper charts to meet carriage requirements).
I don’t know who those “personnel in a position of knowledge” are, and Maptech won’t say, but I’m quite dubious about the “knowledge” part while also thinking that the “VISION” makes perfectly good sense in context and is not to be feared. Let’s have a look.
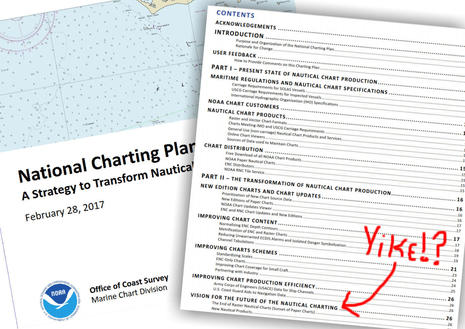 In my opinion, the National Charting Plan — PDF download here — is quite well organized, written and illustrated, and very much worth a careful read. I learned new details about the current state of U.S. and international charting and also found lots to like about planned improvements, which include NOAA’s acknowledgement that current ENC vector charts have issues. All of that occupies almost 26 pages of the Plan and some improvements like metrification — changing all depths and heights to meters — are presented as “maybes” with commenting invited.
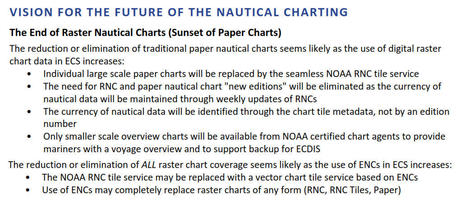 And here is the entire “Vision for the Future…” section that appears after all the detail about planned improvements to both NOAA’s raster and vector charts. Notice that the “The End of Raster…” subtitle is arguably misworded since the entire first section is about what may happen due to the decline of paper charts that “seems likely as the use of digital raster chart data in ECS increases.”
Yes, of course, NOAA sees an increase in the use of paper-chart-like Raster Navigation Charts (RNC) in electronic charting systems (ECS) like chartplotters and phone/tablet apps. It’s a fact that NOAA very much helped enable and which is certainly evident on the water today. On my test boat Gizmo: the Furuno, Simrad, and Raymarine plotters, plus charting programs like Coastal Explorer, TimeZero and Fugawi, plus apps like iNavX, TZ, and Memory-Map, can all display raster charts either downloaded directly from NOAA or reprocessed from NOAA raster files.
These days Garmin is the only major plotter brand that does not support raster charts, and I believe that they are going to correct that situation fairly soon. I like NOAA raster charts a lot — especially in comparison to plain NOAA ENC vectors (though Garmin, Navionics, and C-Map vectors largely based on ENC data are fine) — and I like having multiple copies of them on multiple devices. If I thought that updates to all those paper-like charts were going to end in June 2018, I would holler. But where’s the evidence?
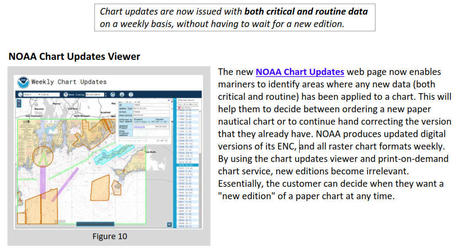 In fact, NOAA has just improved raster chart updates in a fairly major way (vector ENCs too). As you’ll learn in the Plan, it used to be that “routine data” like shoreline changes and non-critical depth surveys was only added to charts when a new edition was created. That was a processing relic from when printing charts was the primary form of distribution and it’s also one reason that the Jonesport Breakwater took years to chart. Now all critical and routine changes are processed into weekly ENC and raster updates (and thus edition dates are irrelevant). This is factual good news (except perhaps for printed charts, though only because they will appear to go out of date faster).
Early last year, NOAA also started distributing a new seamless tiled form of electronic raster charts in addition to the PDF and BSB files that correspond to traditional paper chart areas. I first saw them used in the BoatBeacon app and while I didn’t mention it because they work and look just like other raster charts, the developers told me that they are much easier to manage in code and memory.
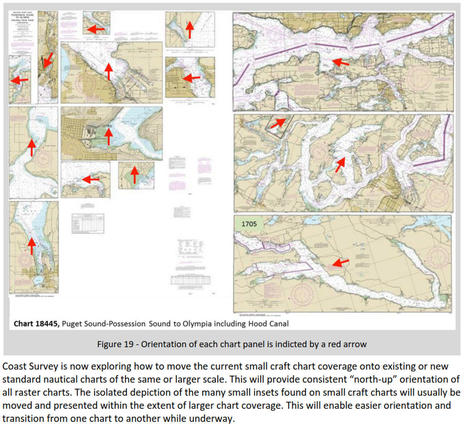 Another raster chart improvement discussed in the Plan has to do with small craft charts. Remember them? I have not used a paper one in many years but some charting programs and plotters try to display them while others don’t even try. And that seems to be NOAA’s point above. The multitude of orientations to North that made it possible to fit a lot of chart detail in small paper panels is terribly messy in terms of quilted electronic chart presentations. The Plan does not detail further how the valuable raster data seen on SC charts will be normalized to North Up, but it certainly may favor electronic presentation over paper, and why not?
In 2017 does anyone believe that charts should be dependent on paper presentation over electronic where there has to be a choice (which isn’t often)? As Maptech pointed out, and the Plan details, by next June all SOLAS vessels on the planet will be using electronic charts, not paper. Non-SOLAS commercial vessels in many countries are switching to electronic navigation systems, and most recreational boaters I observe navigate primarily with a plotter, perhaps with paper charts as backup and/or for general planning. Those are facts, and yet the use of paper-chart-like rasters is increasing, at least in the recreational world, and NOAA is actively improving rasters.
 So take all that into account when you read a “maybe someday” VISION sentence like “Individual large scale paper charts will be replaced by the seamless NOAA RNC tile service.” What that means is that small area raster charts formatted to fit on a large piece of paper that hardly anyone would ever have printed on demand may go away. (Few vessels are required to buy them any more, and recreational vessels hardly ever do.) And it certainly does not mean that raster chart imagery is going away, or even that third party companies can’t print chartbooks. (In NOAA speak, “paper charts” are specifically those big expensive individual beauties, not printed charts in general.)
Maptech confirmed to me that they can create their print products using raster tiles and that they can even print chartbooks using ENC vector charts, though they say that’s hard and they might not do it for less popular areas. But, meanwhile, NV Charts seems to have developed an efficient technique to create very nice chartbooks based on vector data. That NV Long Island Sound paper chart I wrote about in 2012 was created from NOAA ENCs (and a lot of elbow grease), and it seems obvious that vector allows cartographers more options for scaling and manipulating data to fit book formats than simply reprinting fixed scale raster paper chart formats does. (Though I will also note that NV has not yet updated their U.S. East Coast chartbooks, and the age of the reduced price remainders should be much more obvious on NV’s website.)
At any rate, paper charts don’t have to go away even if the “Use of ENCs may completely replace raster charts of any form (RNC, RNC Tiles, Paper),” as stated at the very end of NOAA’s “maybe someday” VISIONS section, and predicated as “seems likely as the use of ENCs in ECS increases.” Context please?
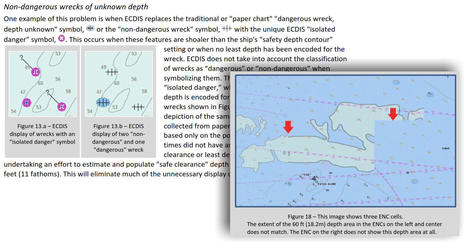 NOAA’s National Charting Plan finally explained to me why those annoying purple icons with question marks boldly appear on many ENC charts, though they do not usually appear to mark any real danger. NOAA also wasn’t shy about pointing out confusing inconsistencies in ENC depth contour quilting and how imperial to metric measurement inconsistencies can cause unwanted ECDIS alarms. None of that strikes me as what an agency would do if they were about to dump RNC raster charts and just offer ENCs.
The Plan does favor the future of vector charts. Heck, that’s an international fact; in ECDIS ship systems, raster digital charts are only allowed when ENCs are not available. That’s also why Maptech’s “current director of OCS was quoted in a media account as saying that it was ‘a major pivot point at OCS’ and that ‘the paper era is finished'” is not as dire as it sounds. (The “media account” is this fine Three Sheets Northwest article.)
But note that the vague eventuality “seems likely as the use of ENCs in ECS increases” is about plotters and apps, not ECDIS. It seems to me that NOAA is quite aware of ENC shortcomings in the recreational environment, but hope to improve them to the point where we use them. They also seem quite aware of how resistent to change many of us boaters are.
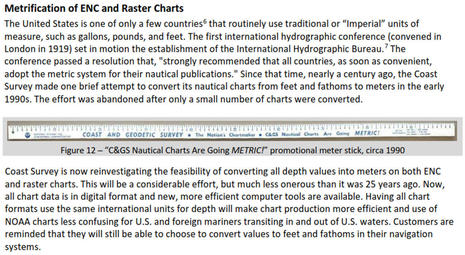 There’s a certain dry humor to the Plan’s section on metrification. Did you realize that the international marine community started lobbying for a sensible metric standard nearly a century ago? No, I haven’t gotten used to metric units either, but I am aware that aircraft pilots, engineers and many other professionals who work with international standards have somehow gotten comfortable with what looks like a pretty easy measuring system. How entitled are we, especially when metric-imperial conversions are causing us hassles while also costing taxpayers? Maybe this is the season to put at least one chart display screen in metric depth?
I highly encourage U.S. mariners to read NOAA’s National Charting Plan and to decide on the call to action issued by Landfall and Maptech for themselves. And I’ll close with testimony from a person of knowledge who is willing to give his name. That’s John Nyberg, Chief of the Marine Chart Division at NOAA Coast Survey, who emailed this to a mutual acquaintance on Saturday morning:
Our National Charting plan was meant to start the discussion about making ENC truly for everyone – not to end paper tomorrow. We would very much like for ENC to be the product of choice – meaning that recreational mariners want to use them. We know that there is much work to be done on the ENCs and derived products (Including paper) in order to fulfill this goal and that it could take a very long time to make it work.
John is working on a full “response to some of the recent criticism” which I’ll link to when available. Now does anyone feel the need to call their congressman? Seriously, while I obviously don’t feel the need, opposing opinions are welcome here.
PS 5/31: NOAA responded smartly to the end-of-all-raster concerns, I think, and so did the BoatUS Foundation. More detail in comments below.


I don’t think the time is right yet, but when and if I call my congressional representatives about NOAA, it will probably be to protest draconian budget cuts:
https://oceanconservancy.org/blog/2017/03/04/a-noaa-budget-that-cuts-to-the-bone/
After the email from Landfall, I sent a note to Senator King. Soon I received a phone call and subsequent email from Peter Benoit in his office and Peter had researched the topic, referred me to your post (which I had not yet seen) and copied me the link to the report. Very impressive response from Senator King’s office and bodes well for his watching out for boating interests, particularly in the face of the proposed “draconian budget cuts.”
Thanks for taking the time to post your excellent analysis.
Denham
Denham, thank you so very much for taking the time to tell me about your experience. It’s gratifying. I’d like to think that anyone might have gotten those results from their senator or congressman, but it’s especially nice to hear it was from my own Senator Angus King. I have heard that he runs a crack office and I’d also like to think that he’s on the road to becoming a stellar U.S. Senator.
Calling our representatives is a great privilege, some fascinating history here:
http://www.newyorker.com/magazine/2017/03/06/what-calling-congress-achieves
I can’t wait for my electronic charts to be updated weekly with the latest from NOAA. It seems silly that I can get realtime traffic for my car but my Garmin chart plotter has to wait months (or more!). To learn about a new bouy location. I applaud the Office of Coast a survey for putting together a cogent plan which will move us into the future. This is real progress. I love paper charts and use many to decorate my home. I even have them on the boat however the more efficient tool is reciently uodated electronic charts. Landfall, Maptech and others need to help ensure that electronic products improve our safely and experience and not just claim the sky is falling.
I’ll bet that my plotter is internet connected and getting regular chart updates a la active captain database updates in less than five years. It does not have to be always connected but just enough so it updates perhaps when I get fuel …
Pat
Re: Metricification … I got used to the metric system when I was one of Uncle Sam’s troops, and I don’t have a problem with metric depths and distances — BUT — I do have a problem with how conversion might get done – when a sounding shows “35 feet”, replacing that with “10.66 meters” is just plain wrong, because the original measurement is NOT within 100ths of a meter in accuracy. Same for channel widths and lots of other depicted values. The problem is that figuring out the ‘best’ conversion and rounding algorithm is a non-trivial task, and perhaps not a good one for the MFD’s electronics to handle.
We just cruised the Bahamas with both our RayMarine plotter (nm and feet) and a book of Explorer Charts (meters), and the only issue was the mental shift required when changing references (getting older is a factor in mental agility!).
NOAA has responded well to the raster worries, I think:
https://noaacoastsurvey.wordpress.com/2017/05/31/noaa-clarifies-national-charting-plan-vision-for-production-of-noaa-paper-charts-and-rncs/
“We recognize the continued popularity and dependence of many of our users on our paper and raster charts, and NOAA will continue to update these charts with all critical information. Despite some reports to the contrary, the draft plan does not offer a timeline for ending the production of NOAA paper charts or RNCs. We expect this process may take decades to complete, as user communities continue to adopt electronic navigation and our production system and products continue to improve.”
They also extended the comment period a month and finished with an interesting story about a new Merrimac River ENC that’s notably contrary to Maptech’s claim that ENCs are all about expensive ECDIS systems and charting waters where ships go.
https://noaacoastsurvey.wordpress.com/2017/03/02/collaborative-effort-to-create-new-nautical-chart-returns-recreational-boaters-to-haverhill-massachusetts/
I’ve already seen the new free chart live in the free iOS and Android app SeaPilot. It’s not as nice looking as a raster chart, but my feelings about ENC change radically when it’s used to create new large scale coverage for an area that never had it and where a new raster chart is understandably impractical.
https://www.seapilot.com/
Ben,
You stated, “No, I haven’t gotten used to metric units either, but I am aware that aircraft pilots, engineers and many other professionals who work with international standards have somehow gotten comfortable with what looks like a pretty easy measuring system.”
This is not totally correct. Here’s a good article on the units used in aviation: http://aerosavvy.com/metric-imperial. Moreover, US made aircraft are designed and built using imperial units. This includes all fasteners.
“Not totally correct” is kind, Norton Rider! Thanks, that’s an interesting and fun article. At least all pilots use the wonderful nautical mile — it’s earth centric, not cultural — for measuring courses and tracks over the ground. But it’s not reassuring to learn they have to mix meters, statute miles and feet when dealing with runway lengths and visibility.
Did you delve into the anti-metrification link…
http://www.slate.com/articles/technology/books/2014/08/john_marciano_s_whatever_happened_to_the_metric_system_reviewed.html
…though obviously no expert myself, I too would “love to hang out with Tom Wolfe and talk furlongs.”
I’m reminded of hearing the impressive Navigator of the U.S. Navy advocating for all electronic navigation 15 years ago in a fairly spectacular setting. The pictures are lost but my description of the scene is still online:
http://www.powerandmotoryacht.com/navigation/practical-navigators
The all digital, and probably all vector chart, future seems obvious to me too, but I don’t see anyone rushing it, especially not NOAA. The naysayers should relax.
Ben, At least in Europe everyone uses nautical miles, not kilometers, in measuring distances in the sea. The same for speed is knots, not KPH or MPH like in the US. Got used to the metric system for everything else (land use) coming from the US. Perhaps my biggest problem is relating to temperature for preconceived idea of what is really cold weather – below 0ºF. I grew up in Puerto Rico and there they really confuse everything. In land, distance in KM while speed limits are in MPH, gasoline and milk are sold in liters but soft drinks in ounces. I give up.
Ben – your comment about chart compatibility caught my eye –
“On my test boat Gizmo: the Furuno, Simrad, and Raymarine plotters, plus charting programs like Coastal Explorer, Time Zero and Fugawi, plus apps like iNavX, TZ, and Memory-Map, can all display raster charts either downloaded directly from NOAA or reprocessed from NOAA raster files.”
As of today, I have not figured out how to upload free NOAA BSB raster charts to my Simrad NSS EVO2 – and the manual and dealer don’t know either. My previous Furuno Navnet 3D system worked easily just by uploading the chart file off an SD card. So, I’m stuck with either the unimpressive included Insight charts, or purchasing Navionics or CMap charts – am I missing some technique here, or did I misunderstand your statement?
Yipes, Grant, that’s a low information dealer. Fugawi has offered NOAA raster charts that work on NSS Evo2 since about 2014, mentioned here:
https://panbo.com/archives/2015/06/the_paper_chart_still_the_best.html
As of 2015 they became available for download on the GoFree Shop (which is run by Fugawi):
https://panbo.com/archives/2015/03/raymarine_chart_store_the_lighthouse_format_go_international.html
I have to say that I’m having a hard time finding the “Fugawi Aboard” NOAA raster charts at the GoFree Shop right now — they seem to want you buy C-Map or Insight 😉 — but the cost for a region or the whole East Coast should be about $10, like this:
https://www.fugawi.com/store/product/TT-TILE-NOAA-RNC?taxon_id=6
Note that no MFD I know of can display straight NOAA raster files; they are all reprocessed, including Furuno’s (by MapMedia). That may change now that NOAA is serving tiled rasters that are MFD and app friendlier.
I believe the USCG uses yards for distance measurement.
Ben, your wealth of knowledge on all issues chart-related is surpassed only by the detail of your responding posts – many thanks for steering me in the right direction here! And I’ll be sure to share this with the local dealer… 😉
I too grew up in Puerto Rico and got used to using the various units. Some of the Metric ones come from having been under Spanish rule prior to 1898 (road distance markers in KM, for example), as well as Puerto Rico being an early adopter of the US Metrication initiative (fuel dispensed in liters).
In addition, there are a few older, archaic units of measurement still in common use in the island. For example, many in PR use a cuerda as a measurement of land area. One cuerda is approximately 3,930 square meters or 0.97 acres.
” No, I haven’t gotten used to metric units either, but I am aware that aircraft pilots, engineers and many other professionals who work with international standards have somehow gotten comfortable with what looks like a pretty easy measuring system”
Say what??? I am a commercial pilot and I buy fuel by the gallon, altitude is in feet, weights are in pounds, manifold pressure is in inches, oil temperature is in degrees Fahrenheit, and I can’t recall any metric units for anything.
Also note that OpenCPN works wonderfully with raster charts and generates an unusable mess with ENCs.
Thanks, Coquina. I was definitely wrong about the pilot part, but I already received my comeuppance in comments above.
I was semi wrong about Simrad multifunction displays using NOAA raster charts. They can, but neither source is currently available. The $10 Fugawi Aboard download that used to be available at Navico’s Insight Store…
https://panbo.com/archives/2015/03/raymarine_chart_store_the_lighthouse_format_go_international.html
…is not available at the GoFree Shop that’s now run by C-Map (instead of Fugawi):
https://gofreemarine.com/shop/
I also have a C-Map 4D Max+ card for Simrad NSS that nicely includes a set of NOAA raster charts in addition to C-Map vectors, but surprisingly that format is not currently available at the GoFree Shop either. I suspect that a new 4D Max+ format for Navico MFDs is in the works, and that will be good, but I hope they will also consider offering an inexpensive NOAA raster only chart set again.
Thanks for confirming that Ben – I spoke with Fugawi, who directed me to GoFree “Support” – which unfortunately for all intents and purposes doesn’t exist. The Navico support line directs you to “press 1 for Lowrance and GoFree products…” – but after multiple calls and disconnects, all I got was folks who presumably know a lot about fishfinders and zero about charting. I finally talked to Craig on the Simrad side, and he apologized that the whole Gofree charting division was “in transition”, and there was no one to talk to about charting options (or the lack thereof). Instead, he directed me to NV Charts – which provides raster charts for Europe and the East coast – but zero for anything on the West coast.
So I guess if I want to view raster charts aboard my boat, I need to rip out the Simrad gear and go back to Furuno/Maxsea. Or, paper…. ;-( Very discouraging…
Dang, I got confused again, but the news is good, Grant. The format of the Simrad C-Map card I have with a raster chart layer is called C-MAP MAX-N+, not 4D Max+. Here are the product details here:
http://lightmarine.c-map.com/marine-navigation/chart-plotters/c-map-max-n
The West Coast Wide MAX-N+ card retails for $299 but contains a whole lot more than a full set of NOAA raster charts, which they call “dynamic” because the vector info on nav aids and similar is nicely accessible by touch or click on the raster presentation.
You can theoretically download the cartography bundle (8.1 gigs!) to your Simrad NSS evo2 here: http://www.gofreeshop.com/?c=NA-Y024
But it’s also available at outlets like Defender:
http://www.defender.com/product.jsp?path=-1&id=2953199
StarPath Navigation put up a great page of links to NOAA chart assets that aren’t always easy to find:
http://www.starpath.com/getcharts/
I’m also impressed with David Burch’s new book about vector charts, called an “Introduction to Electronic Chart Navigation” (which I am slowly reviewing). No one is going to take your raster charts away anytime soon, but ENC vector charts are the future, and this book can help you use them better.
https://www.starpath.com/catalog/books/1996.htm#
(Also available in Kindle and iBook formats at lower cost)
Ben, thanks for both those posts – I too spoke with C-Map on the phone, and learned about the raster charting included in the Max-N+ charts – not cheap at $300, but it sounds like the most complete and easiest solution for my NSS Evo2. Still a little frustrating that all those freely downloadable NOAA products end up essentially unusable on current technology chart plotters – at least mine.
I’ll check out the Starpath links ASAP – thanks again,
Today NOAA announced the next step: They will stop updating all raster chart products, paper and electronic, at least by 2025, maybe sooner in some cases depending on feedback from chart users and vendors. But it doesn’t mean the end of paper charts and many NOAA vector chart improvements are in the works.
I’ll post a full entry about this later today. In the meantime, lots of info here:
https://www.federalregister.gov/documents/2019/11/15/2019-24807/sunsetting-of-raster-nautical-charts
https://www.nauticalcharts.noaa.gov/updates/noaa-seeks-public-comment-on-ending-production-of-traditional-paper-nautical-charts/