
Cartography lessons learned searching for the best charts of Cuba
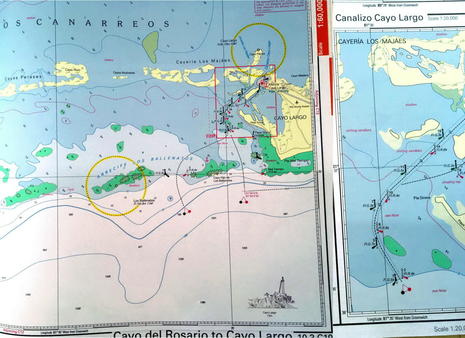
Pardon my photography, but the point is that many detailed, up-to-date, and well-crafted official paper charts of Cuba do exist. Unfortunately, they’re not easy to own and the good work of the Cuban hydrographic service is also not yet fully available in any electronic form. In fact, many “current” electronic Cuba charts are based on shockingly old data with substantial chunks of critical cruising detail missing. But visiting boaters do have at least one good current chart choice, GeoCuba is moving into the modern world, and the back story reveals chart issues every navigator should understand, with a Cuban twist…
While I’ve already discussed my lazy spring Cuba cruise in terms of how well the DeLorme inReach satellite tracker/messenger worked, I also took along five sets of digital Cuba charts to compare on my iPad. The results were both alarming and confusing. I’ve never seen charts that differed so much in quality for the same area, and I subsequently learned that even the best probably do not include all the nav data that the Cuban HO has collected, though some include information that the Cubans themselves may not have.
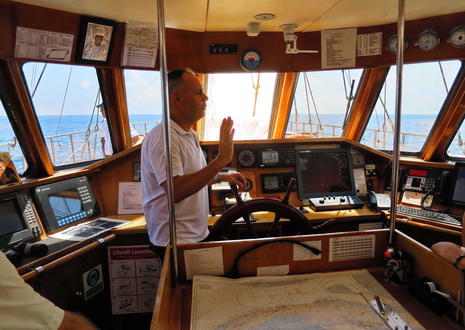
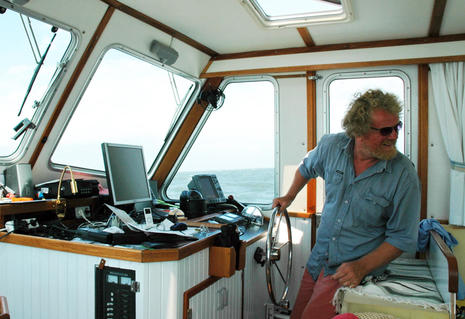
Fortunately, it was actually the Greek skipper above who was responsible for the navigation, along with his mates, and their primary charts were paper ones produced by El Servicio Hidrográfico y Geodésico de la República de Cuba, more simply known as GeoCuba. (Historically it’s been difficult for yachties to purchase these charts, even in Cuba, or simply to find out what charts GeoCuba has, but there’s some good news on these issues at the end of this entry.)
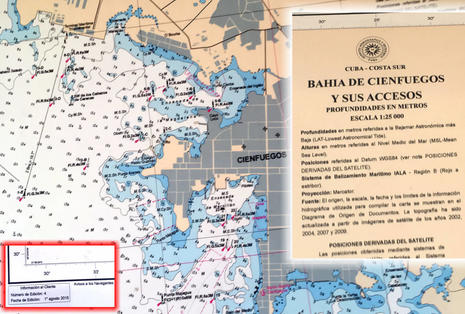
 The watch officers of the Panorama II appreciated the accurate detail available on Cuban charts like the 1:25,000 scale Bahia de Cienfuegos 2015 edition I photographed in their wheelhouse — and they’re required to use paper charts anyway — but they too yearned for the same data in electronic form on which they could continuously plot their position. Surprisingly (though perhaps due to the lack of an ECDIS requirement and budget), the small cruise ship’s main navigation software seemed to be OpenCPN freeware displaying some sort of vector charts that had little detail of Cuba. The first mate did have an Android tablet running Navionics Mobile, which currently offers one of the better data sets for Cuba, but first let’s discuss the winner of my comparison testing.
NV Charts, winner
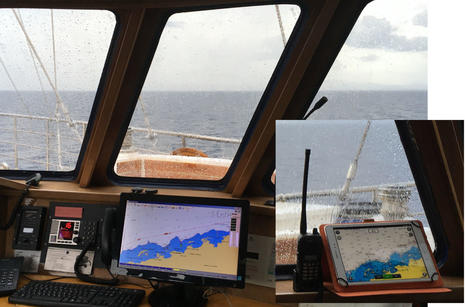
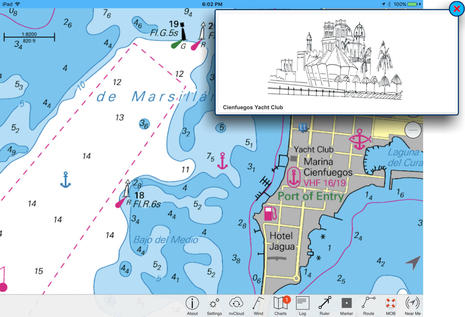 The Panorama II navigators were quite impressed by the NV Charts I could use to track the ship on my iPad and also on my Android phone. In fact, the paper-like NV digital raster charts of Cienfuegos appeared to contain all the detail of the largest scale Cuban paper charts plus NV extras like recommended courses and click-to-show sketches of major nav aids. I can’t say for sure that NV matches or exceeds Cuban HO detail everywhere around the big island, but in comparison to the Garmin, C-Map, Navionics, and MapMedia charts I checked out, NV seemed superior, usually by a wide margin.
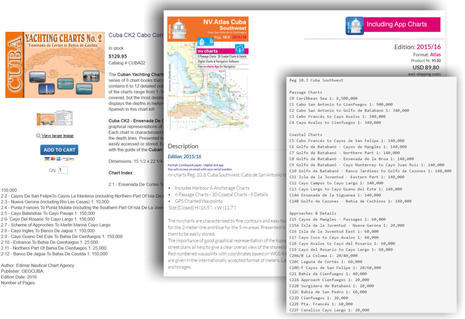
 While I’ve long appreciated NV’s unique paper and pixel approach to chart making and the company has been producing Cuban charts for some time, the NV Cuba Southwest and Cuba Northwest “combipacks” I took along on my cruise are the results of a major Cuba refresh NV introduced in 2015. They’re based on data from NV’s own surveys and “other sources” — a telling story I’ll get to — and the included chartbook is in a handy new “atlas” format that’s about 16 inches high and 12 wide (when closed). The digital version of the charts no longer comes on a CD, but the download routine is easy and generous.
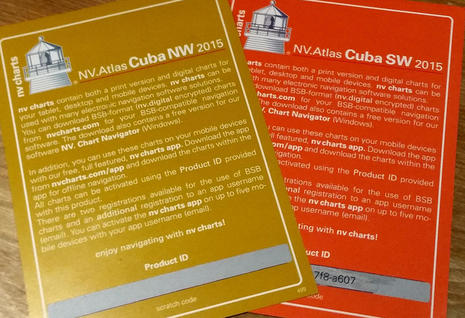 This photo of the chart download scratch cards that come with NV Charts combipacks may be especially useful as the NV site is a little vague about the specifics. In short, you get two copies of encrypted BSB type electronic charts that will work with PC navigation programs like Coastal Explorer, MacENC, and, yes, OpenCPN. You can also download the charts into as many as five devices running NV’s own Apple, Google, or Windows charting app, which has evolved nicely since I tried it in 2013. (Please note that all these chart copies are only meant to provide backup and flexibility for one user, and violating this understanding may cause harm to those of us who play by the rules.)
Digital-only NV charts of Cuba (and many other places) can also be purchased on SD card for Navico plotters, downloaded for Raymarine plotters at the Lighthouse Chart Store, or acquired for several other worthy nav tools at Fugawi’s online chart store.
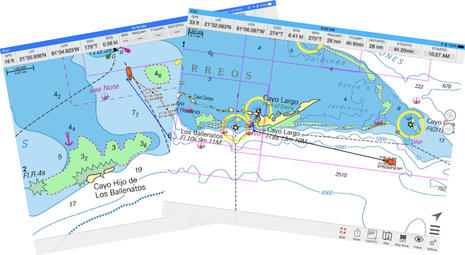 These screens illustrate NV’s iPad app at work as Panorama II motorsailed to the crystal blue anchorage off Cayo Largo, but let’s focus on NV’s data sources because isn’t that the key to good charts? Chart presentation is important, but only if the nav data presented is close to reality. Many of us who cruise the coasts of the U.S. or Europe may get complacent about chart accuracy, because whatever chart brand we use is based on quality data from the same official source, like NOAA or the UKHO, but that attitude is folly in places like Cuba (as you’ll soon see).
However, I can only vaguely describe how NV Charts sourced their Cuba charts even though I recently spoke at length with Hasko Scheidt, who founded NV in Germany with his wife Conny more than 35 years ago. In fact, Hasko began his “sources?” answer with a story about how NV beat his own country’s HO to market with quality charts of East German waters soon after the Berlin Wall came down in 1990. He says that’s when he fully realized that he could endanger data sources by revealing their identity, and he cited a similar experience with a Cuban cartographer who disappeared after several years of friendly meetings (and maybe more) at international hydrographic conventions. “Hopefully, he got to drive a cab!”
That may sound like the stuff of spy novels, but international chart data sourcing is mysterious. Claims of plagiarism are rampant, commercial chart manufacturers often resist revealing their sources for competitive reasons, and I find it quite credible that some cartographers are more interested in sharing their good work with mariners than abiding by the bureaucratic rules they may work under. Add the U.S. embargo on Cuban imports that even extends to foreign companies doing business in the U.S., and you’ve got a sourcing mess with multiple mysteries.
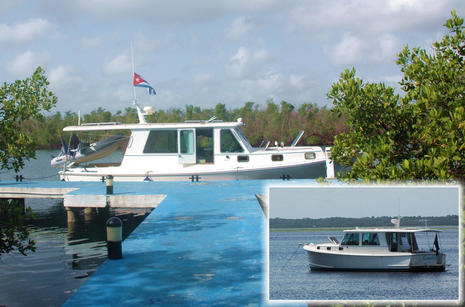 At any rate, at least some portion of NV’s current Cuba chart offerings is based on original surveying by Scheidt and his crew using the company’s handsome Duffy seen above at Marina Vita. “Other sources” seem to include some GeoCuba data as well as third parties like the British Admiralty and the U.S. National Geospatial-Intelligence Agency (NGA), who have sometimes produced their own charts covering some Cuban waters and possibly based on GeoCuba data, which, incidentally, is said to be largely the creation of Russian hydrographers back in the ’70s.
NV, like many other cartography shops, also uses high resolution satellite photography, though Hasko noted that he’s seen a number of Caribbean charting errors where reefs were shown as islets or vice versa because it’s hard to distinguish the two with only a birdseye view over clear ocean.
 So it’s good for a chart maker to get out on the water, especially after they’ve already combined multiple data sources and identified areas of concern. I’m not sure what Hasko is doing in this photo, but he did get me laughing as he described how poor his Spanish got on the few occasions when local coastal authorities tried to interrupt one of his Cuban survey tracks, and how that fine Duffy suddenly got very slow to turn.
Learning from the rest
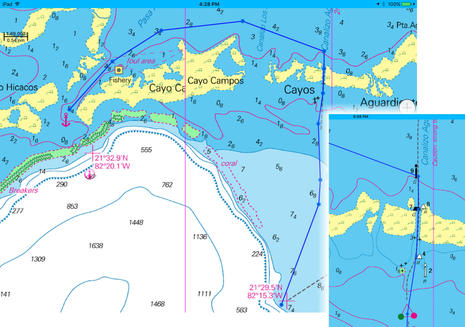
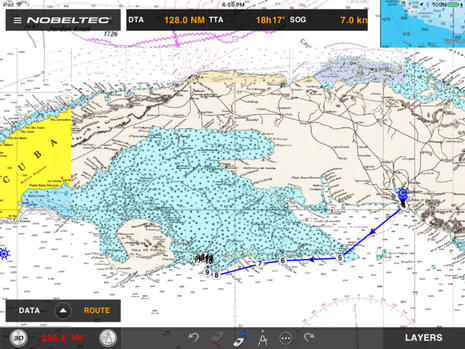 Now let’s see how the vagaries of data sourcing are revealed in other digital Cuba charts, and enjoy some armchair cruising along the way. The Nobeltec TimeZero App screen above is showing zoomed-out MapMedia raster charts along with a route I planned from Cienfuegos westward past Cayo Largo to a tantalizing anchorage off Cayo Campos. Notice how four different charts were quilted together to best fill this zoom level, and judging from their different color and font styles — rasters are essentially just scans of paper charts, after all — they’re all from different sources. This turned out to be a bad sign, and if the data was in consistent vector form, the hodgepodge of sources would not be obvious at all.
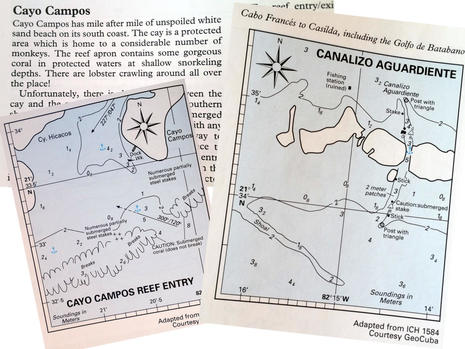 Why Cayo Campos? I’d also borrowed a copy of Nigel Calder’s Cuba: A Cruising Guide — published in 1999 after a herculean survey cruise, but possibly being updated as I write — and the prospect of a preserve with beautiful beaches, abundant lobsters, and the chance to hang out with monkeys got my attention. And while Nigel’s suggested (breaking) reef entry to the anchorage didn’t appeal even to my armchair cruising style, the alternate route via the Canalizo Aguardiente seemed reasonable, and he’d created chartlets of both, apparently based on fairly detailed GeoCuba charts. (I did compare all these chart sets to the real world wherever Panorama II went, but she was too deep for Cayo Campos and I didn’t get to set the itinerary.)
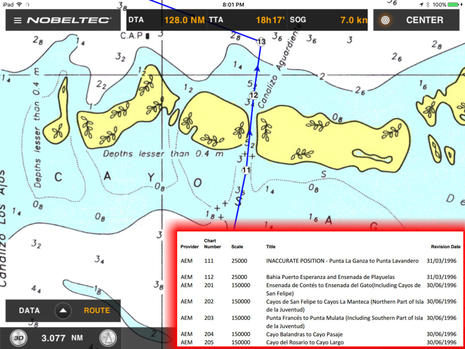 But, dang, when I zoomed into MapMedia’s chart of the Aguardiente Canal, it didn’t even show the nav aids that Calder had either copied from a Cuban chart or surveyed himself more than 16 years ago. Unfortunately there’s no way in the TimeZero app to see the scale, date, or source of the chart being displayed — a common problem — but if you dig into the MapMedia online catalog there’s a Caribbean chart list that looks pretty good for everywhere but Cuba (partially inset above).
Much of the coast, even the commercial entry port of Cienfuegos, is only covered to 1:150,000 scale, all the Cuba charts date to the mid ’90s, and, oh, some are marked on the obscure list as INACCURATE in terms of GPS plotting. I even came upon one scan with dead reckoning penciled on it, apparently by the former owner.
I really like using the TimeZero app with MapMedia’s reprocessed NOAA raster charts and, of course, they also work great on Furuno TimeZero multifunction displays, but the value of a good nav app or plotter plummets if the charts are poor. (Note, however, that Furuno MFDs can also display MapMedia vector charts based on Navionics, C-Map or HO data, so confidently cruising Cuba with a Furuno plotter may be possible.)
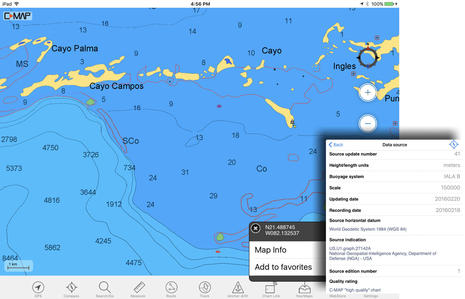 I’ve also seen some great U.S. charting in C-Map’s Plan2Nav app, and the reputation of C-Map’s global cartography is high, but don’t presume good Cuba coverage. This screen of the Cayo Campos area shows all the C-Map detail there is. You can zoom in all you want, but you won’t get anymore information about the reefs off the monkey island or the back route through the canal.
But let’s credit C-Map for always providing data source information, even if the dating looks questionable in this case while the source and scale suggest the overall problem. NGA vector charts, also called DNCs, have always seemed limited in coverage compared to what many nations produce for themselves, especially in terms of non-commercial cruising areas, and some of the paper versions are “No longer available for public sale.”
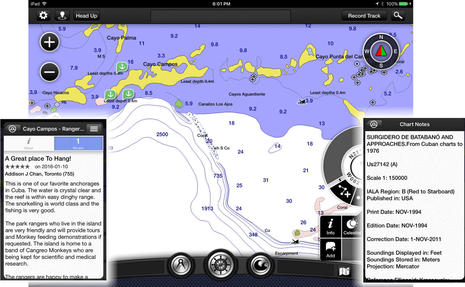 The usually lovable Garmin Bluechart Mobile app had a very similar Cuba problem. What you see above is all there is for the same area, it too is based on the same 1:150,000 scale US27142 NGA chart that C-Map sourced, and I’ll bet that the 1994 edition date (like MapMedia’s) is correct. I also wonder exactly what got corrected to 2011 since all three of these chart providers do not seem to use any Cuban HO data, probably because of the embargo. But then again, Garmin BCM did allow me to have Active Captain cruising data in Cuba, although my iPad was never online (and the AC coverage there is getting useful largely thanks to Addison Chan, who also hosts the Cuba, Land and Sea FB page).
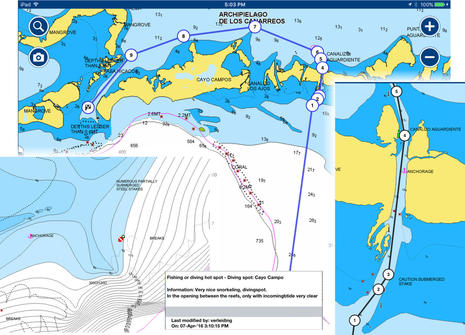 Finally, here’s the Navionics Boating app and thankfully this data looks pretty good, at least for Cayo Campos and some other areas I examined. Click the screenshot collage above bigger to see the canal nav aid details, a cruiser’s Community Edit, and how the SonarChart view seems to illuminate the reef entry (though “numerous partially submerged steel stakes” still puts me off).
Unfortunately Navionics typically does not indicate data sources on their app or any of their other chart formats, but, then again, the Navionics WebApp — cruise to Cayo Campos here — lets you see any of their charts before purchase (and wouldn’t it be nice if the other chart providers followed suit). Upon questioning, Navionics did allow that they have “ongoing negotiations with” GeoCuba though “we cannot disclose details at this time.”
 That sounds similar to what I heard from NV Charts, which not surprisingly also covers the Cayo Campos area well. While I did notice that NV had more detail than Navionics in a few spots, both provide much more chart information than the other three and I think it’s due to some level of access to Cuba’s own data. So it’s good news that Garmin and C-Map both say they’re working to establish relationships with GeoCuba, and I’m sure that MapMedia is similarly inclined. Plus, there’s evidence that GeoCuba data is getting more accessible to individuals and cartographers.
GeoCuba & Bluewater good news
 I only recently thought to ask Bluewater Books & Charts about their Cuba offerings, which was dumb since their style is to offer everything available — loaded Cuba page here — along with expert advice that’s honed by customer feedback. Plus, their home location in Fort Lauderdale means the Caribbean is their backyard. But it was reassuring to have the salesperson pretty much affirm what I’d concluded on my own in Cuba, which is to say that many of the digital Cuba charts that Bluewater sells are not very good.
Bluewater does recommend NV’s Cuba charts, though some of their skippers have reported issues, and also Nigel Calder’s guide, though they’re looking forward to Volume 2 of Cheryl Barr’s Cruising in Cuba as well as more in the Waterway Guide Cuba series. What they’re really excited about, however, are the GeoCuba Yachting Chart books they now exclusively offer in the U.S., and where that relationship is headed.
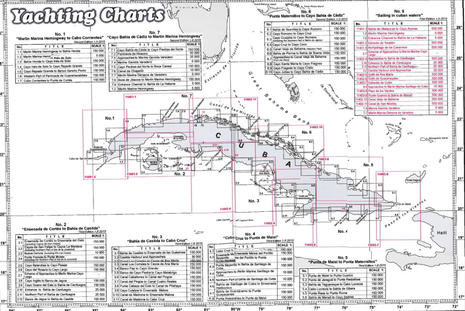
I later spoke with Bluewater’s owner, John Mann, who’s proud about how hard his team worked to establish a smooth system for moving charts from Cuba to Lauderdale and payments the other way, both still tricky even with some relaxation of the embargo. He also lauds the quality of the GeoCuba Yachting chartbooks –which come in 7 regions, with Cuba CK8 sort of an overview — though I have to express a little skepticism as I’ve never seen one and the detailed listings look light on large scale coverage.
 Compare, for instance, GeoCuba Yachting Charts #2 with NV Charts Cuba Southwest. Does the GeoCuba chartbook cover Cayo Campos and similarly seductive cruising spots around the Golfo De Batabano as well as NV? I don’t know for sure because I may not fully understand how GeoCuba’s chartbooks are laid out, but I’m hoping that Bluewater will put some detailed images online soon. And of course I also hope that readers with Cuba chart experience will speak up.
And while you may have noticed that GeoCuba chartbooks are fairly expensive, especially since no digital versions are included, how about the individual GeoCuba paper charts at $45 apiece? But there’s good news here. From my Panorama II experience, I suspect these are worthwhile for big-budget yachts and for the rest of us Bluewater’s downloadable GeoCuba chart catalog PDF is a valuable asset at no cost.
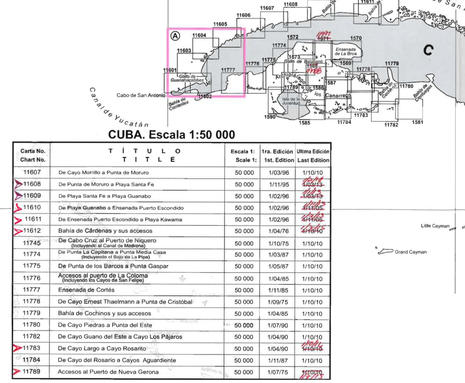
When I taught navigation in classrooms or boats I always brought along NOAA chart catalogs mainly because it’s critical to understand what scales the primary cartographers committed to, and that’s especially true with electronic charts because the underlying scales are not obvious but usually still define the true level of detail and accuracy. An official chart catalog is also useful when you’re trying to figure out what a mysterious third party chart bundle should include, so thank you, Bluewater.
For instance, the section of GeoCuba catalog above indicates that the whole Golfo de Batabano area is charted to 1:50,000 scale, close to the 1:40,000 coverage that NOAA provides for most of the U.S. coast (with one exception leading to a vector chart issue I analyzed here). 1:50,000 means that the cartographers felt that they had sufficient survey data to detail the area to that scale and that then they did their best to portray the most important navigation information that would fit on a chart sheet that size.
If I ever get the chance to actually gunkhole Batabano, it would be nice to know that my digital charts were sourced from GeoCuba’s complete and latest data, though I’m sure that supplementary info from the likes of Hasko Scheidt, Nigel Calder, ActiveCaptain, and Navionics crowdsourcing would be appreciated.
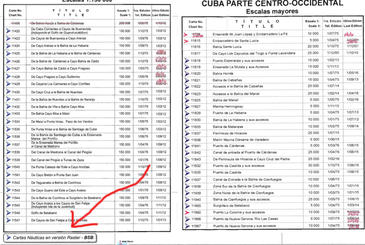
It may look odd that GeoCuba’s catalog is manually updated, but all the GeoCuba charts Bluewater sells are also hand updated to the most recent information and, besides, check out the “Cartas Nauticas en version Raster – BSB” notation called out above. The ability to plot on official Cuba digital charts is imminent. Indeed, 120 of GeoCuba’s full 170-chart portfolio have already been rasterized into BSB type electronic format and GeoCuba is committed to selling them through Bluewater according to John Mann. He hesitated to estimate exactly when or at what price, but he did add that GeoCuba definitely wants to get its data out to potential cruising visitors and also that he’s informally serving as a liaison with some of the commercial chart makers.
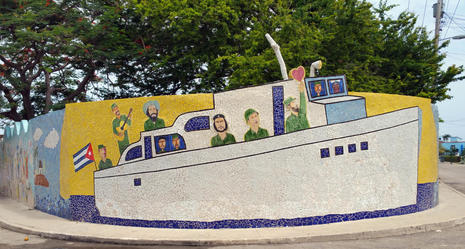
NOAA too has forged a relationship with GeoCuba, but, wait, could all this progress be reversed by a new U.S. President? While Cuba cruising expert Peter Swanson is somewhat concerned, Mann seemed optimistic that the surge of promising Cuban business relationships like his will not be easily stopped. We’ll all know better as 2017 unfolds, but I certainly hope that Americans will still be able to cruise Cuba without much hassle, and I’ll close with one of many good reasons to go.
José Rodríguez Fuster is a multi-talented folk artist whose exuberance seems to have affected a whole neighborhood near Marina Hemingway, and the tile work on this particular Fusterlandia corner celebrates the remarkable 8-day voyage of Fidel, Che, and 80 of their comrades from Mexico to Cuba in 1956 aboard Granma, an already old 60-foot yacht they’d surreptitiously purchased in the U.S. for $15,000. I have no idea what they had for charts, but they made it.
PS 12/31: Sorry I failed to come up with a holiday entry this year, but everything is well in Panboland and lots of interesting stuff is on deck for 2017. Here’s another view of Fusterlandia — just the outskirts really, many wilder photos here — and let me end 2016 with: Viva USA! Viva wherever you live! Viva boating! Viva marine electronics! Viva Panbo advertisers! Viva you, dear readers, and happy new year!


Thanks for this post. Skulduggery and furtive movements in the chart vault!
Is there a publicly available utility for generating/updating MM chart packages for Furuno MFDs? Specifically, my brand-new Furuno MFDs carry the latest chart chips, but their US East Coast data is more than a year and a half old. The old MaxSea V10, which I still use, has a utility for converting S57 files into whatever internal format MaxSea uses (.C00), and it works like a charm. It sure would be nice to be able to apply new charts to my MFDs as they come out.
Obviously, MM uses such a utility to generate the files they deliver, but I haven’t found anything comparable available to the public.
I have been sailing Cubian waters for many years and have found that often charts created from satellite images give a clear view of the passages through the reefs. Here is a link of chart created using GE2KAP from the Eris staelite ArcGis.Imagery for the area around Cayo Campos and you can clearly see the reef passages:
http://gdayii.ca/Downloads/Eris_satellite.jpg
Thank you, phiggins! It looks like you are author of GE2KAP… http://www.gdayii.ca/ …and it looks quite interesting.
Larry, I don’t know the answer to your question but notice that the new TimeZero Professional V3 can read S57 charts directly…
http://www.maxsea.com/products/software/tz_professional
…and of course a version of TZ is what runs in Furuno NavNet MFDs. So maybe the S57 feature will eventually arrive in the MFDs?
Great article and comments so far.
Thank you, Ben, for all you contribute to boating, digital boating, and the Good Life.
happy new year.
What the awesome post.
Honestly, I didn’t read it to the end and bookmark the article to finish later. The great knowledge base with good valued source links.
I just wanted to make my two cents relating the topic about Cuban nautical charts. I am the ex-navigating officer and used to sail many times to Cuba for loading grapefruits and oranges to be carried to ex-USSR ports. It was back in mid 80-ies and first 90-ies. Not any electronic charts were available just satellite navigation NAVSTAR and first nonmilitary GPS receivers. The primary source of navigation was radar observation, DECA and LORAN-C somewhere.
So the detailed paper nautical charts with due corrections were crucial for safe navigation. Yes, and, at least our company ships have such charts and weekly Notices for Mariners (not Admiralty but USSR Ministry of Defence edition ). As far as I know, that the Russian hydrographers did surveys and not all data were globally available.
So my two cents is that actually there are high-quality hydrographic survey data for Cuban waters. Otherwise how we could cruising 21 knots on 500 feet length and 23 feet deep draught reefer ship on Cuban coastal waters.
Another interesting thing about Cuba, one can find many very old American books and magazines in Havana.
Ben, do you remember a magazine published in 1948 called “The Rudder”? “America’s First Boating Magazine”
Do you remember the section “Gadgets New and Old” by J.A. Emmett?
Thanks, Dan! The WoodenBoat library in Brooklin has an excellent collection of The Rudder and other historic boating magazines, so I’m somewhat familiar. Better yet, Google Books has some fully scanned older issues and I absolutely lucked into this 1910 issue almost entirely devoted to a powerboat race from Philadelphia to Habana:
https://books.google.com/books?id=jqw6AAAAMAAJ&pg=PP1#v=onepage&q&f=false
Fascinating on many levels!
Happy to report that the Nobeltec TimeZero (and Furuno TZ) charts for Cuba have been vastly improved since I did this research. MapMedia, the sibling company that processes all TZ charts, now has an agreement “directly with the Cuban HO” to use their paper charts. And the new raster charts just became available on my iPad’s iBoat app.
Note that I was given a long license for testing purposes, so regular TZ iBoat users may need to pay the $25 annual renewal fee, but also that iBoat Caribbean also includes Central America. And that MapMedia nicely publishes lists of all the included charts with sources, scales, and revision dates:
https://mytimezero.com/charts-catalog/list/caribbean/raster/wide/mapmedia/caribbean
https://mytimezero.com/charts-catalog/list/caribbean/raster/wide/mapmedia/central-america
Drat, this update email from Nobeltec suggests that in-app chart pricing is going up, largely thanks to Apple rules:
“We will soon have to use a unique pricing for chart subscriptions due to App Store rules…
FYI It is impossible to sell subscriptions with different prices on the App Store (Eg: Starting price at $50 and renewal at $25)
This is why Navionics is also using a unique price now.
We will most probably sell this area {Caribbean discussed above} for $49,99/year and this will include all the updates for 1 year.”