
Navionics SonarCharts, now via SonarPhone or GPX file, plus the Lowrance autopilot
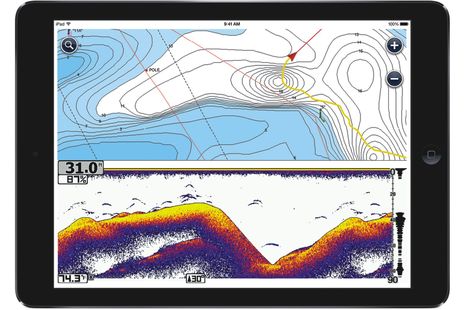 Wow. Combining the Navionics Boating apps and the Vexilar SonarPhone WiFi fishfinder seems like an obvious development now, but there are so many marine electronics integration possibilities these days that even the ripe low-hanging fruit can be surprising. Announced yesterday at ICAST (PDF here) and available for iPhone/iPad in August (and Android later), the combined Navionics SonarPhone app means that a small boater can have a fairly sophisticated plotter/fishfinder for about $200, phone or tablet not included (and note the issue of screen visibility in an open boat). I was impressed with the SonarPhone bobber-style T-Pod in April and suspect that SP200 T-Box small boat model works even better. And there’s more: the users of this system can very easily contribute their sonar logs to Navionics’ SonarChart collection, which they can access (along with chart updates) with an additional $25 Navionics+ annual subscription.
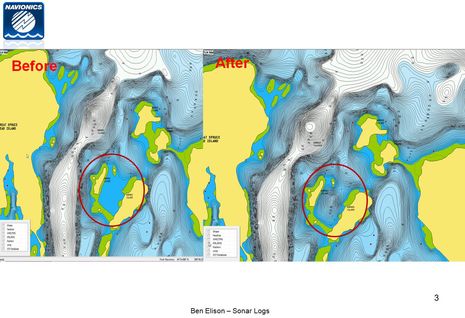
I first mentioned nearly effortless Raymarine sonar log uploading when Navionics Boating 7.0 came out and then bragged about how neatly the data had come back to me as a SonarChart during a June shakedown cruise. The subject deserves more discussion. It helps, for instance, to see the before and after images that Navionics sent me after I uploaded a sonar log that included the Barred Island anchorage above. You can also see how the improved SonarChart next to the NOAA chart on the Raymarine gS12 here. I’m tickled that I was able to improve charting of that neat spot, but I must add that it seems like Navionics made a lot of soundings presumptions from just a track or two of my sonar. I also wonder where the heck all that other SonarChart detail comes from…
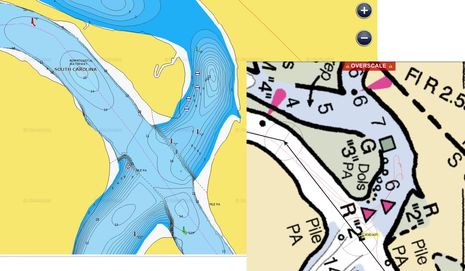
When SonarCharts first came out on Navionics+ cards last summer, I was somewhat disappointed because almost all the data seemed to be what Navionics used to call Fish’n’Chip, which I first saw in 2006, and not based on soundings recently collected by cruisers. I have no idea where the Fish’n’Chip data came from or how old it is — which is also the case with the “hi def” bathymetry offered by Garmin, Furuno, C-Map, etc. (I think). And when I looked at the SonarChart data for some difficult places I know firsthand, it didn’t look right. One spot I remember not liking is the Callabash River anchorage above, which is vaguely charted by NOAA and has confusing nav aids to boot. But I failed to take a screenshot last summer and when I just looked again, the SonarChart (above and live here) is looking like what I remember. In fact, it might have been updated with my data (you can see Gizmo’s 10/2012 track line on the inset NOAA chart).
At any rate, I recommend using SonarCharts carefully and wish they included some source/date info. It’s also telling that the chartplotters that can show SonarCharts do not overlay them with aids to navigation (as you can see on the Ray gS12 screen). I hope that will change but will certainly understand a prominent disclaimer about how the soundings are not official data.
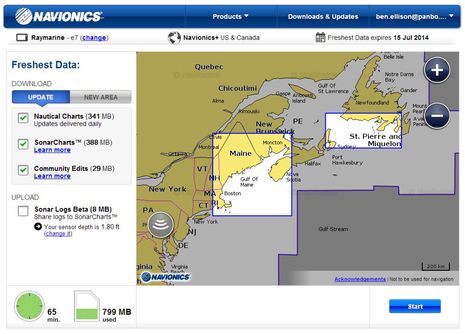
Now let’s note that you don’t need the Navionics app and a tablet to upload sonar logs, and you don’t need a Raymarine MFD to create sonar logs either. On July 8th, Navionics announced that they are also accepting sonar logs in GPX and other formats used by Garmin, Simrad, Lowrance, and Humminbird. You upload them using a plain SD card (or Navionics card) and the Chart Installer software that will download under the Navionics website’s Downloads & Updates button. The screen shot above shows Chart Installer working with a Navionics+ card last summer when sonar logs were being beta tested (and were hard to set up). I’ve found Chart Installer to be a little flaky sometimes, but it is getting better and it’s generally pretty easy to upload sonar logs and/or update a card with an associated + subscription.
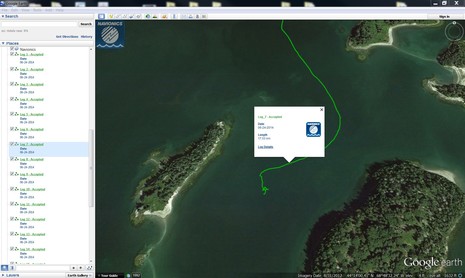
Using the Navionics Boating app with a Raymarine MFD is by far the easiest way to contribute sonar logs, but I’ve successfully tried the SD card method and also GPX files. One neat feature of the system is that once Navionics has checked out the file and added it to the SonarChart database, they sent a KMZ file of your track that opens Google Earth nicely. So the track above began after lunch on the day I’d already seen an improved SonarChart of Barred Island harbor, and this track’s data hopefully improved on what I’d already uploaded. I’m looking forward to collecting sonar logs and KMZ tracks as far as South Carolina this fall, and hoping that others will be doing the same before I get there.
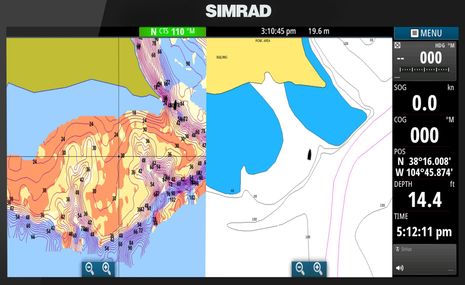
Navionics is trail blazing crowd-sourced depth charting, but who will be surprised if other companies also make this possible? Actually Navico, who already offer the private Insight Genesis custom charting I tested a bit last summer, just announced a Social Map layer that sounds a lot like SonarCharts. It’s based on existing contour data with fresh user-collected soundings added by Insight users willing to share their data, and it can be viewed on Lowrance and Simrad MFDs. Judging from the NSS16 evo2 screen above, it also includes information on bottom composition. Meanwhile, Humminbird is out with its AutoChart system, which lets you make your own custom MFD charts at home, no subscription needed.
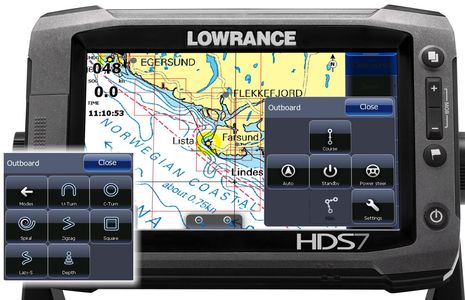
Mapmaking is particularly important to freshwater fishermen, and some of them want to keep the data to themselves, but maybe Humminbird will eventually allow the others to share with the world. And before I go, I’ve heard about a couple of other fishing-related electronics announcements at ICAST. Garmin announced a DownVü/SideVü thru-hull transducer to be shipped 3rd quarter, which can also be installed in a pair so most any big boat will be able to use the technology Bill Bishop told us about. And Lowrance announced an outboard autopilot that won’t be available until November but sounds intriguing. It can, for instance, switch from controlling an outboard to running a MotorGuide Xi5 Pinpoint electric-steer trolling motor, and as shown inset below it can do all sorts of automated maneuvers. Plus, it seems reasonable at $999 for the hydraulic model and $1,499 for cable steering, with Point 1 heading sensor included.


I too wonder where Navionics got all the soundings for Barred Island anchorage. Ben, soundings along your track are of course accurate, but the rest is just fiction.. The problem is how would I tell which is which?
I am a supporter of the idea of crowd sourced chart data, but Imaginative soundings like this will give the concept a bad name. It would be much better if Navionics would show your track and the soundings you generated, and leave the rest blank.
So the Humminbird Onix 8si with AutoChart won the ICAST Best of Show in the electronics category. And sister company Old Town won best boat and overall best of show with the Predator XL fishing kayak that can be run hand’s free with an electric drive made by Minn Kota, yet another sister company. Johnson Outdoors is some proud:
http://www.marketwatch.com/story/johnson-outdoors-dominates-icast-new-product-showcase-2014-07-17?reflink=MW_news_stmp
Understand your concerns, Rick, and note the SonarChart doesn’t seem to show the ledges on the north side of anchorage very well. Compare to the excellent Google Map photo:
https://www.google.com/maps/@44.2321265,-68.8080796,912m/data=!3m1!1e3
The crowd-sourced soundings collect in the Argus project are shown in the way you favor at Cruisers’ Net (though not available on an MFD):
http://cruisersnet.net/cruisersnet-marine-map/?ll=34.6805333333,-77.1123333333&z=14&highlight=1
The Doyle’s On The Water ICW AnchorGuides — now available as digital books at very cost — employ the same technique, just showing the data they’re sure of:
http://www.onthewaterchartguides.org/icw-anchorguides/#tab-id-3
RE “but I must add that it seems like Navionics made a lot of soundings presumptions from just a track or two of my sonar. I also wonder where the heck all that other SonarChart detail comes from” and “And when I looked at the SonarChart data for some difficult places I know firsthand, it didn’t look right.”
Absolutely right. The SonarCharts for the problem areas I know well in FL (Jupiter inlet and Boca area) are off by a mile!!! Sonarchart says 1′ actual depth 17′ and another location sonar says 8′ actual depth is 1′ – uth! Navonics should just scrap their sonar chart and show the actual spot soundings along with source data (which user uploaded, and ability to correct or comment).
I was wondering about the “neat feature” mentioned in the text — if you already had a GPX file, you could open it in Google Earth yourself and then save it as a KMZ file. GE also opens other GPS formats, but it does not open DAT, SDF, or ADM. Why do companies like Garmin have to invent their own proprietary formats? If they can justify the need to write their own, why does it have to be proprietary? I don’t feel comfortable putting my own data into proprietary formats, for philosophical reasons and also because of the risk of it being orphaned. I see there is also a proprietary Raymarine FSH format.
Ben, as a Maxsea PBG (bathymetry) user one of the key elements in gathering spot soundings is the ability to change the reading according to tide. Maxsea does this automatically while you can do this with your sounder it is cumbersome to be changing it continuously. In addition, you can filter results automatically via filters and review your own soundings and erase/change those which you feel are incorrect.
In a small boat it does not make much difference where your gps is installed relative to the transducer. In a large boat they could be many meters away from each other and you will always have that difference. Again, a proper bathymetry gathering program will account for this difference as well.
I assume Navionics is using mathematical formulas to draw the contour lines. The fewer the spot soundings, the larger the error as all they will do is draw the lines with what they have. Ideally, the least they could do is show the points of the real spot soundings and let you make the decision to believe them or not. Computers are great in making complex calculations, and they are usually correct, but garbage in means garbage out.
Here’s a great utility called Mapsdata which allows waypoint to KML conversion.http://digitalyacht.net/2014/07/07/adding-a-waypoint-list-to-navlink-ipad-app/
Norse, sometimes proprietary file formats are needed to capture the data desired, and I don’t think it matters much if there is a way to get at least some of the data into a common format. You can, for instance, download all your Garmin data to the now free Homeport software and export to KMZ, GPX and more. Navico MFDs let you save data as GPX and KMZ. Raymarine uses GPX now. I don’t think there’s really a problem.
Excellent Navionics Boating app news: Update 7.1 gives a year of Freshest Data and SonarChart use to anyone who’s already purchased a Navionics chart region. Before 7.1 my USA app couldn’t replace already downloaded charts with fresh ones and wouldn’t let me see SonarCharts; now it does.
I thought the change might have happened because I already have a Navionics+ USA chart card with freshest data registered to the same account. But “everyone for free” is confirmed:
“7.1 does upgrade everyone for free. If you had a chart region purchased, automatically you received an upgrade to Navionics+ which means you now get 1 year of Updates as well as SonarCharts. Users who had the boating app and only using the free Government charts do not receive a free upgrade, however when they now purchase a chart region that are getting Nautical Charts, SonarCharts, and updates for the year, not just the nautical charts as it was before. Essentially, we went from a 2 purchase situation down to a single purchase and grandfathered everyone in. This is now in line with the same policy that exists on plug and play cards.”
Is pricing for the Navionics Boating app in any way affected by owning a (current?) Navionics plotter card? Or vice versa? If so, how?
I am not really a tablet person and it doesn’t play any role in navigation on our boat other than as a backup of a backup. Even so, years ago I bought the “Europe” version of this app along with Denmark & Greenland. I remember a tour by tender of downtown Kopenhagen where it was nice to have but that was really the only use I ever got out of it.
I have to concede, though, and am amazed, that on many boats, some big and expensive, with tens of thousands of electronics on board, apparently all navigation is with this app only and the array of plotters appears to only be turned on like you would turn on the navigation lights.
With my old Europe version I found the chart areas that can be downloaded too small to be of much use on an extended trip. When we started from the Azores towards Europe, we planned for England but had alternative destinations of Brittany/France or A Coruna/Spain or Kinsale/Ireland. I found that I couldn’t even load a chart area covering Land’s End/UK and Brest/France at the same time and since we had no internet connection underway, this app failed even as a backup of a backup.
Henning, I think that Navionics hopes to eventually make the “+” subscription features of a user’s chart card also available in the app, but right now they are separate (and working around Apple in-app purchase rights is an issue).
So right now if you want to see the freshest chart data and also SonarCharts on both MFD and tablet, you need two subscriptions. The same is true if you have a current Raymarine model and want to auto load fresh charts from tablet to MFD. Which are some reasons why they are giving a one year “+” subscription to everyone who’s bought a Navionics app chart region.
Have you tried updating to 7.1 yet? Hopefully you’ll find that you now have access to very fresh charts for all those areas you bought long ago (when the apps were very inexpensive ;-).
I don’t understand why you were limited to downloading small areas. That should be just a function of space available on your mobile device. I do recall that in the early days the Navionics app often choked on large downloads but I think you could always make several small downloads to cover a large area.
Ben – I think Navionics will have to make the “+” subscription features of a user’s chart card also available in the navionics app or face the loss in popularity of that app. Right now I enjoy the Navionics app and the iNavx app, and also use the Navionics chart card data in a Raymarine plotter. But the cost of refreshing all that chart data is getting up there.
With the Navionics + chart card data available to copy to a hard drive of a PC – and with software like Digital Yachts Smartertrack available on a Windows 8 based tablet I will not be refreshing the Navionics App past the current free upgrade. The Navionics Sonar Charts subscription for iPad is the equivalent of $US80 per annum in New Zealand.
The iNavX app will survive as it does a wonderful job of getting the NZ official raster charts (our NOAA equivalent) onto a tablet device.
Cheers Dave
R.e. “On July 8th, Navionics announced that they are also accepting sonar logs in GPX and other formats used by Garmin, Simrad, Lowrance, and Humminbird”
The GPX-based work-around process provides no truth source with which to compare depths against. That means that maps made (or updated) with the GPX process could include some bad data and therefore be inaccurate in places.
Here’s just one way bad data can cause inaccurate depth readings on maps created with GPX files:
Let’s say we make a lead-line sounding on Spot X, determining with no doubt that the depth is exactly 14 feet. If your sonar transducer is crooked – perhaps bumped by a log or rock; perhaps the nut came loose on its mount – you will get an inaccurate depth reading at Spot X, say 24 feet for example. The depth reading is wrong because your sonar signal is not shooting straight down at the bottom like it should be, but rather at an extreme angle, thus making the bottom appear much farther away from the transducer than it actually is.
In this situation, a GPX-based mapping program would draw contour lines based on your latitude, longitude and that inaccurate depth reading. But such a system has no truth source to verify that depth reading.
But with the Lowrance/Simrad/B&G Insight Genesis sl2-file-based system, however, there IS a truth source – your sonar log. A signal from a crooked transducer displays in your sonar log with visual indicators that any one of the trained professionals on the Insight Genesis Quality Control team can recognize and throw out — preventing bad data from getting into your map.
A variety of user-initiated anomalies can cause a bad sonar signal that results in bad data. They include:
• Reverse thrust
• High acceleration/deceleration rates
• Transducer misalignment
• Hitting bottom/debris
• Cavitation/turbulence near the transducer
• Surface interference
• Vegetation interference
• Poor GPS signal
• Transducer signal disruptions
• Sonar log corruption
Lake maps, contour charts, sonar charts – whatever you call them – can only be as good as the data from which they’re drawn. Bad data, therefore, will create bad maps. As the old saying goes, “Garbage in, garbage out.” This is as true with recording sonar logs as it is with taking photographs – if your camera lens is smudged, or it’s too dark out, you won’t get a good photo. Likewise, if your transducer is crooked, covered in weeds, or too close to heavy prop-wash, etc. you won’t get a good sonar signal. Because custom contour maps are made from sonar signals, a bad sonar signal will create a bad map – or at least a bad portion of a map, depending on where and when your sonar signal was compromised.
That’s why the Insight Genesis Quality Control team reviews thousands of sonar logs every week, searching out and removing bad data that resulted from user-initiated anomalies on the water. A trained professional on the QC team compares your custom map’s contour lines against your sonar log recording – a truth source that displays exactly what you saw on your sonar screen while on the boat – to verify that each map you make is accurate and precise.
If your map is not compared against your sonar log by a professional trained to understand sonar imagery and interpolation models, you might as well just eyeball depths and draw contour lines with a crayon on a can koozie. Without review by real, live, trained professionals, there’s no way to be confident in the validity of all the data from which your map was built – which means there’s no way to ensure the accuracy of your map.
Trained to see telltale signs in your sonar log of the kinds of problems bulleted in the list above, Insight Genesis’s QC professionals will delete from your map any compromised data that would cause inaccurate contour lines. While this will leave a few holes in your map, it’s easy to drive back over those spots the next time you’re on the water and fill in the blanks. Merge the data from your follow-up trip log with your original trip logs and you’ll have the most accurate, most highly detailed custom contour map available anywhere.
The Insight Genesis Quality Control team was built after asking one simple question ¬– would a customer prefer a map that’s 85% accurate or 99% accurate? The answer is clear, so the Quality Control team works every day to make Insight Genesis maps as perfect as possible for all subscribers, regardless of their subscription level. No other custom-mapping service employs a similar Quality Control team.
That’s why Insight Genesis custom contour maps are better than other DIY-mapping programs – with the others, you are truly doing it yourself; with Insight Genesis, a team of trained Quality Control professionals is always on hand to help.
The example of a crooked transducer is just one of many possibilities. Any one of the user-initiated anomalies in the bullet list above could cause bad data that, in turn, could cause the “bogus” contour lines that bothered Lutes. The Insight Genesis QC team, however, ensures that your data is both fresh and accurate.
http://insightgenesis.wordpress.com/2014/08/13/q-why-dont-some-depths-on-my-map-match-the-depths-displayed-on-my-fish-finder/
This is Giuseppe Carnevali, president and founder of Navionics.
Frankly I could not believe my eyes when I saw Navico lowering itself to making such outright false statements against Navionics.
Obviously they are either down to malice, or they do not know what they are talking about, because in addition to the most advanced technology we do have a quality team, and we do check every single track that comes in, and we do have very sophisticated means to check and calibrate every single sounding, and we do filter out bad data; in fact as much as a third of all track data that comes in is rejected for one reason or another.
Navico’s long tirade against Navionics on Panbo is a piece of shameful marketing. Instead of going down to slanderous statements like this, why not let a good product speak for itself?
I have been watching this interesting debate and waiting to answer it all when questions got a little more stabilized, but such false statements needed a prompt and vigorous and focused answer.
Giuseppe Carnevali
Thank you Giuseppe and Greg! It’s fantastic when developers stick their necks out here on Panbo, and the pride and passion both of you have about what you do is obvious. But please play nice.
I don’t think I’m the only boater who thinks that what both Navionics and Navico are doing with crowd-sourced bathymetry is great. I have no intention of relying on it, or any other single source, but I like it. And I’m hoping that you’ll make it so easy to contribute data that eventually many of your expert cartographers can relax as algorithms peel away bad data simply because it doesn’t compute with all the good data coming in.
Am I dreaming?
Ben, et.al.,
This is Shane Coloney. I’m the Product Manager for Cartography at Navico and I manage our Insight Genesis service as well as Navico’s relationship with our partners at Navionics. I don’t typically get involved in these kinds of posts but after seeing the concerns Guiseppe raised regarding Greg Huff’s comments I wanted to take a moment to clarify for your readers that Greg’s comments were not intended to slander or cause malice to Navionics. In fact, Greg’s comments were not directed at any particular company or map provider but were in response to the previous questions raised by other readers specifically regarding the accuracy of using the .gpx data versus other data sources.
We stand behind Greg’s statements which explain why the use of point data from a .gpx file is inherently less accurate than using all of the available source information contained in a sonar log. This is true regardless of the capabilities of the Quality Assurance teams that may be reviewing the data. That was the intended point of Greg’s post and we apologize if anyone misunderstood that.
As a long-time partner of Navionics we know and appreciate the high quality of their product offering and would never disparage them, especially in a trusted public forum like Panbo. We proudly partner with them and successfully bundle their products with ours around the globe.
Ben,
As promised, I am answering to the various readers’ questions.
Essentially there are two ways of making charts.
The first is the classic one: take relatively few but very accurate soundings.
If you use a lead line you have centimeter level accuracy on your spot soundings, but such soundings are few and far apart. Chances of missing important details are high, as testified by the famous accident in which the QE2 ripped its bottom over uncharted rocks in Massachusetts in 1992. The NOAA charts were very accurate in their spot soundings, but missed the rocks that were between them. What most people do not know, is that a lot of official nautical charts around the world are still based on lead line surveys, in some cases (like in Bahamas) more than a century old.
Of course nobody does lead line soundings today, but do rely on sonar that is fraught with error: water salinity, temperature gradients, the inherent inaccuracy of the instrument itself, can cause readings that are wrong by several feet, even when the sonar says that the data are “good”. A skillful review by a trained eye can filter out obvious noise due to factors like bad transducer installation or air bubbles, but cannot detect instrumental error. To reduce such error, Hydrographic Offices like NOAA use sonars that cost millions, operated by people that do nothing else in their life; of course this cannot be a viable proposition for a recreational boater wanting to make their SonarCharts.
So the second and more advanced system is based on taking a whole cloud of soundings, all randomly inaccurate, but by applying advanced mathematical algorithms plus the black magic of many years and millions of surveyed acres of experience, you can get much more accurate than with any other means.
Needless to say, the more dense the cloud of readings, the more accurate you get.
This is why Navionics has gone the “social” way for years: instead of using sonarlogs from one individual person and one individual manufacturer, we combine logs from all. We integrate into a single seamless cloud the logs from Garmin, Humminbird, Lowrance, Simrad, Raymarine, Vexilar and others. All combined, and also thanks to our easy to use online service for freshest data, our community probably aggregates orders of magnitude more sonar logs than any individual manufacturer.
The accuracy is in the density of the cloud, which means the number of sonarlogs, not in using a specific data format.
Easy? Of course not: there is a reason why there are scores of companies who do crowd sourcing, but Navionics is years ahead in developing the seamless cloud concept.
Of course all this is breaking new grounds, and there is still a lot of room for improvement. I agree with you that nobody should ever rely on any chart, because they all have errors, but I think that nobody can dispute the principle that the more dense the cloud of data, the more accurate the resulting chart will be, and that aggregating data from multiple manufacturers is better than doing it from a single manufacturer.
I also agree with you that the key is to make it as easy as possible for the community to upload the sonarlogs. In this respect we are seeing that boaters really appreciate the manufacturers that encourage instead of impeding their customers to upload sonarlogs to Navionics, even more appreciate the hassle-free ease with which they can upload sonarlogs and download chart updates directly from our app with the plotters that support the “plotter sync”, and we expect that they will appreciate yet more the real-time, no-action-required integration with devices like the SonarPhone that you describe in your article.
In this respect I am happy to announce that very soon our customers will be able to enjoy the best of all worlds: while boating with our app they will see the navigation and the sonar on the same screen, plus they will see the SonarChartLive being created in real-time, giving instant gratification and feedback on the quality of the data, plus the sonarlog will be automatically uploaded to Navionics, where it will be processed by our Quality Assurance team with the full power of our central system and combined with the cloud of data from the rest of the community, and about a week later they can get the freshest and best possible SonarChart. All hands-free, no action required: “it just works”.
One last remark: you and your readers are right in saying that it would be good to provide some kind of confidence map, some means of understanding where enough data were collected to make the chart reliable, and where the community members have an opportunity to be the early explorers. As I said, there is plenty of room to improve, and we are working on that.
This debate reminds me the early days when we introduced the world’s first electronic charts. At an international conference of the Royal Institute of Navigation in London a senior officer said that the Royal Navy should not be distracted by these gimmicks ( the electronic charts) developed by pirates.
I responded that he probably misspelled his words: he meant pioneers instead of pirates, and that pioneers are those who open new roads, while followers are those who complain that the new roads are not wide and smooth enough.
That officer did not go down in history for keeping the Royal Navy on the cutting edge.
Today the Royal Navy Commandos are amongst our customers, and all their ships use electronic charts.
We recognize that the SonarCharts are still in their pioneering stage, but…. we do our homework diligently and know better than the obsolete school of garbage-in/garbage-out; marketing stunts fabricated to discredit us, actually disqualify the speaker like the Royal Navy officer rooted in the past: our track record of always providing the best charts on the market at any point in time proves it.
Giuseppe
Navionics: we start where the road ends
Sent from my iPad
As a sailboat owner, I am most interested in the details of shallow water, and in particular in the narrow entrance channels with huge hidden rocks just off to the side. Big, steep sided, hidden rocks. In these cases, the accuracy of the GPS position and the offset of the GPS antenna and depth sounder are of more concern than sounder inaccuracy. The correction for tide height is also very important.
As it happens, the crowd usually stays in the safe channel as reported in the guidebooks, so crowd sourcing doesn’t add much to the margins of the channel.
As a kayak owner, I do explore the charted rocks and the shallows. I find it quite an eye-opener how far those rocks have strayed from their charted position and how their shape is not as shown on the charts. Same thing with the shallows.
I can also tell you about rocks which are described in all the guidebooks which I have not been able to find.
So I am all in favor of what Navionics and Navico are doing to improve charts. But the bottom line is knowing how much to trust a chart. If the results look more accurate than they are, that is not good either.
When a U.S. Navy ship Guardian grounded last year on a reef that was reported by official charts miles away from its real position, I noted some very interesting articles comparing about a dozen different charts of the same reef.
The conclusion was that all charts have errors, and that the prudent mariner must cross check multiple sources of information to get the best possible truth. This is not about chartmakers trying to cover their backside with disclaimers, it is about good seamanship. Remember that with over 2 billion features in our database, even an accuracy of 99.999% means 20,000 errors. The Norwegian Hydrographic Service in a recent official statement estimated that as many as 30,000 rocks are missing in their charts, and it may take another 30 years to chart them all. In the case of the USS Guardian, radar and sonar and the comparison between different charts could have avoided the grounding.
This is why now Navionics provides 3 full sets of charts, at no extra charge, with its mobile apps: the official NOAA chart, the value-added Navionics Gold chart, and the SonarChart. The user can flip and compare the three charts with a single tap.
My boat is about 3 miles up Bass River, MA, about half of which is incorrectly charted by NOAA (because of obsolete surveys), and the other half is not even charted at all.
Every year at the end of the season I had to get my dented propellers fixed.
Last year, after doing the SonarChart of Bass River, for the first time in 15 years my propellers needed no fixing!!
Does this mean that the SonarChart is always perfect?
Of course not.
The SonarChart starts from the NOAA chart, augmented with other high-quality survey data (where available) and with crowd-sourced sonarlogs.
The NOAA chart can be wrong because it is based on obsolete data, or simply because it has errors, and if no better data is available, the SonarChart is no better than the NOAA chart.
My best advice is to do what I did to save my own propellers: take a sonarlog of your tricky spot, send it to Navionics, and get the best SonarChart of your area. If you can do it from a kayak, going right over all the rocks, so much better. If you do not have a sonar on your kayak, with $150 you can get one as described in Ben’s blog: an investment well worth the peace of mind, let alone the possible damage saving.
If you then go to unfamiliar waters, cross check multiple charts and cross check them with your radar and sonar – and don’t forget to upload the sonarlog… The whole boating community will benefit from it and you will enjoy not only safer charts for yourself, but also the warm feeling of contributing to the safety of your fellow boaters.
Giuseppe Carnevali
Hello All,
Very interesting posts…
I have just stepped of a 52m Private Super Yacht. My role on board is Chief Officer and I have been crewing yachts for the last 7 years. Over the last 1.5years I have been on yachts based in the Pacific: French Polynesia, Tonga, New Zealand and Fiji.
About two weeks ago, whilst underway along the west side of the Yasawa Islands, where the ECDIS charts we were using were very poor, I commented to the Captain how it would be a great idea to use the Echo Sounder Data and send it back to a central hub to enhance sounding data. The whole Pacific (except NZ) is poorly charted but travelled extensively by cruisers and yachties alike.
It was researching this idea that I found your blog and was made aware of this great tech already in use!
My question is: What about for larger vessels, such as the one I was on? We are constrained by the fact that commercial yachts must use type approved ECDIS, with back up paper charts to navigate. With the crowd / cloud based model developing, do you see it as a natural progression to start to supply data to Hydrographic Offices such as the UKHO and from there into Admiralty Charts?
Perhaps unfortunately, Pencil, it does not seem to be natural for government charting agencies to accept outside data. The tendency — understandable, I think — is get ever stricter about data validity requirements and to be very conservative about change.
But I believe that vessels required to carry type-approved electronic charts can also carry other non-official equipment. I’ve been aboard several megayachts that had Transas installed to meet requirements but could also display Nobeltec charting, for instance, and I’ve seen “off the shelf” Garmin and Furuno recreational level plotters and fishfinders on a U.S. submarine:
https://panbo.com/archives/2006/01/bens_big_submarine_adventure.html
But then again it’s hard to predict the future these days, and I’ll note that here in the States, the Coast Guard and NOAA are still conducting a survey about how they can improve navigation. It’s a good chance for crowd sourcing advocates to speak up:
https://panbo.com/archives/2014/07/21st_century_waterways_–_have_your_say_about_the_future_of_navigation_in_the_usa.html
Hello there! Here’s a great conversion tool to turn Google Earth kml format to gpx and vice versa. Just access the platform http://gpx2kml.com/ , select your file and see the results. Maybe it’s useful for you. Cheers!
Sorry to report Garmin Navionics conflict. The latter is beta testing “SonarCharts for Garmin” as you can read here:
http://www.thehulltruth.com/marine-electronics-forum/632494-new-navionics-sonarcharts-garmin.html#b
But Garmin is not happy about it, as expressed in today’s memo to dealers:
“It has come to the attention of Garmin that Navionics is distributing free sample beta charts in advance of a planned 2015 release of a ‘SonarCharts for Garmin’ product range. This content is being developed and offered by Navionics without the participation of Garmin, using tools that afford Garmin no control over the performance or functional compatibility of this material with existing or future Garmin marine products.
Because a safe and reliable customer experience is very important to Garmin, all new Garmin marine chartplotters will have no compatibility with this product. Additionally, compatibility with most Garmin chartplotter devices currently in production is also being removed.
Garmin is not liable for any damages that may result from the use of this content with Garmin chartplotters, and such use may void your Garmin product’s One-Year Consumer Limited Warranty.”
Yike!
Garmin is shooting itself in the foot.
One of the biggest advantages iPads have over traditional chart plotters is that iPads can use charts from many different sources. Boaters can choose what they consider best for them. While I will not be using Navionics charts, others may find them usefull.
I would have thought that Garmin would be pleased that Navionics is planning to distribute charts compatible with their products. Instead Garmin is trying to restrict their customers to only their charts, whether boaters like them or not.
And I’ll bet that Garmin executives are nashing their teeth wondering why so many of us have switched to iPads.
Great tip: Navionics+ cards are going to 16 gig (from 2!) and apparently it comes preloaded with U.S. and Canadian charts while the price remains the same. They are only available from some distributors right now, like here:
http://www.cabelas.com/product/Navionics/1580199.uts
Big thanks to Liz P. for the info.