
C-Maps in Coastal Explorer, never enough charts!
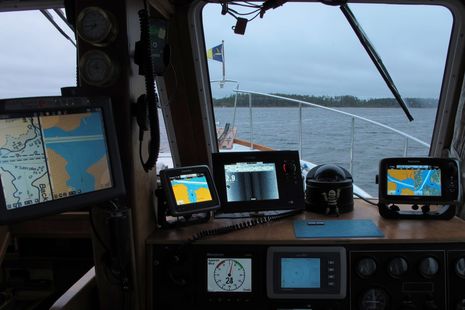
Yes, it sure looks like overkill — and this shot doesn’t even include the iPad that’s often mounted here at Gizmo’s lower helm — but I’ve definitely found ways to put all these screens to work. In this particular scene the boat is crawling out of a very shallow back creek (actually called Back Creek) where we’d hidden from the worst of a cold gusty low that had me wondering if spring would ever materialize. It was still gusting in the high 20’s and that’s only 2.8 feet under the StructureScan transducer that’s fastened to the keel forward. If you look closely you’ll see many chart types, including the C-Map Max format now well supported by Coastal Explorer. The day before I’d gotten a serious reminder about the value of multi charting…
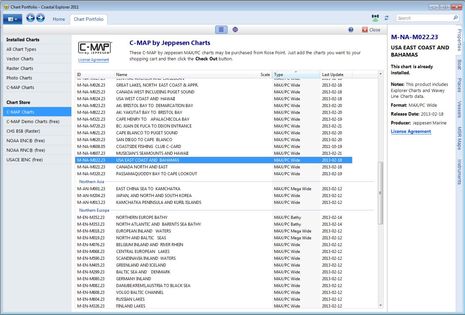
I wrote about CE’s support of C-Maps in late 2011, when the feature was being beta tested, but recently Rose Point kindly let me test their online purchasing system and I must say that it’s slick. There is a add-on module you need to download but once that was done and the transaction made, my home computer downloaded all the C-Map Max charts for the East Coast and Bahamas including additional data like tide stations, port photos and the extra C-Marina detail I’ve come to appreciate.
The neatest part, though, was when I got to the boat and found out how easy it was to sync the purchase to both onboard PCs, as explained here. And, yes, there is a work around if your navigation PC does not have a good Internet link for the download.
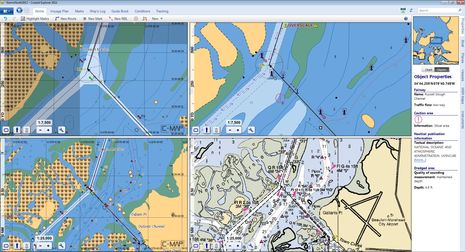
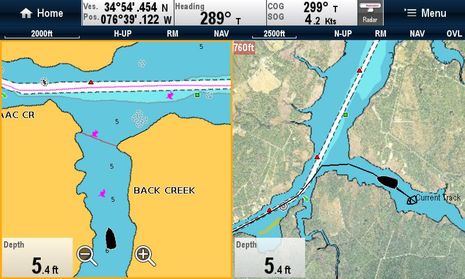
At any rate, I was appreciating the C-Map data presentation right up to my exit from Beaufort, NC, when I started cursing the company! The four panel CE screen above is definitely worth clicking bigger while I explain the detail. First note how I had created a route that cut from the north side of Beaufort to main ICW. This seemed reasonable especially given how the upper left C-Map detail showed a white channel just like it and most charts show wherever areas are dredged to a certain depth. But this is a very confusing area and I was out there in lots of wind and current when I put my binoculars on the first of those two “yellow” beacons marking the final cut and discovered it was a white Danger sign. That’s when a quick look at the NOAA raster chart (lower right) suggested that there was only a foot of water there and the slightly zoomed out C-Map (lower left) put it at “0” feet. Yike.
But after some later investigation I have to give C-Map some credit. The NOAA ENC seen upper right does indeed indicate a dredged channel of 4.9 feet through the Russell Slough, though they’ve presented it in way that much more distinct from the ICW and put a “!” caution mark explained in the chart “object” panel at right. By the way all of these are very current charts — CE is great at updates if online — and thus a vivid example of how confusing data and presentation can be.
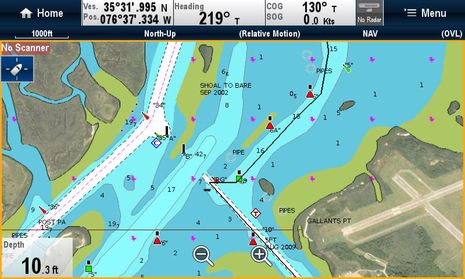
The Raymarine e7 Navionics Platinum+ cartography seen above is not as current as what’s on the CE (I haven’t gotten Freshest Data going yet this year), but it would have kept me out of trouble and was helpful after I made a u-turn and then slowly figured out the alternate channel which seemed at first to have me putting both green and red beacons to port (it worked). I really appreciate how I can fiddle with the “Safety Depth” level on these Navionic charts to get some color shading that’s useful even in these quite shallow waters. The same is possible with ENC vector charts in CE but C-Map has not made that feature available so far (let’s hope for a change).
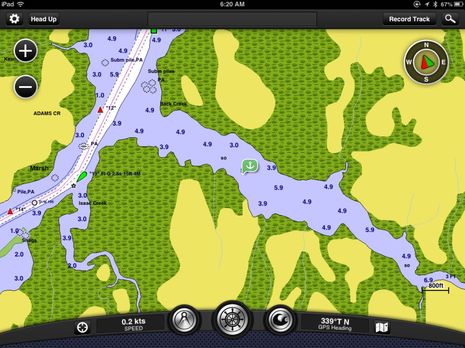
Not that Navionics is perfect either. I have no idea what was meant by that line shown crossing Back Creek above (at some zoom levels), but I know for sure it’s not anything real. But then again I do find the Platinum hi-res satellite photos useful sometimes, in this case indicating enough trees and topography that Back Creek might be less exposed to wind than the regular chart data suggested. But I do wish I’d taken a look at Garmin BlueChart Mobile before I went into Back Creek, because the ActiveCaptain anchorage info would have added to the confidence all those screens seen in the top photo helped me with. I had a nice night there despite the weather. And yesterday I got the Furuno TZT and DRS2 radar all updated and functioning (while anchored in another shallow creek) so now Gizmo has even more chart types and presentations available. I suppose one boat can have too many chart choices, but at least it may generate some more interesting examples of how they can differ.
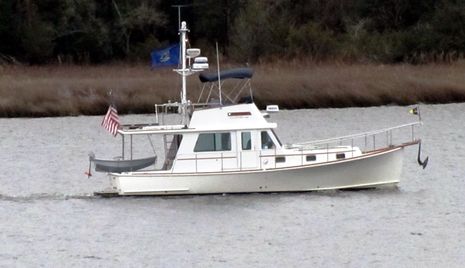
PS 4/21: Thanks to a resident of Back Creek (and the wonders of the Web) here’s a shot of Gizmo taken at about the same time I took the top photo:


Ben, Nice specific on how multiple chart sources can be so helpful – and sometimes necessary. I am feeling really good about my plan to include Coastal Explorer, Garmin, and Simrad displays at my helms. The incremental cost is quite justified by the confidence with which you can pilot through new and sometimes confusing waters. With multiple helms an iPad as a secondary display is a real bargain. BTW I highly recommend the Lifeproof waterproof iPad case. I suspect it is the least obtrusive of the many choices and certainly waterproof – short of swimming with it.
Best wishes for fairer weather as you continue north. Brian
Ben
Took a look at C-map charts for Beaufort using MaxSea. Those nice yellow markers indicate danger…shoal water when I query them. Does the same happen with Coastal Explorer?
Don
Ben,
The C-Map charts could have lead you into a very serious situation had you followed what looked like a dredged channel. Some salvage company would have claimed Gizmo and all the nice electronics equipment in the above picture.
Good thing you have so many chart screens to draw from, but what about the average boater with only C-Map charts and poor visibility? I guess that’s where the start up disclaimer screen comes in handy. Is there any way to report something like this to C-Map?
Good for you for looking out the window and seeing the danger marks! Half the electronic chart mishaps would solve themselves if folks also looked up from their screen as you did and asked, does that make sense?
The C-MAP display is terribly confusing, if I’m honest I’d also see it as a channel.
Happy boating.
Actually, Richard, I suspect that the C-Map channel is correct, as the same information is shown on the NOAA ENC. So I probably could have driven through the Russell Slough, but the C-Map was not good about highlighting the possible shoaling and I definitely could have learned more about what I was getting in to before I got there!
NOAA has not made this area easy to understand. Here are the results I get just in Coastal Explorer when trying to figure out what those beacons are about, as Don suggested:
NOAA RNC 11545, 1:40,000 scale, updated 3/23/2013: shows White beacons “A” and “B” with 1-foot spot sounding in between. Ditto for chart 11541, same scale and update date. 1/3/2012 dated Nav-Chart copies of the same rasters show the area the same way.
NOAA ENC US5NC18M, 1:40,000, updated 3/15/2013: If you have CE “Vector” controls set to “full display” and “show all chart text” the beacons are titled “Russell Slough Channel Warning Daybeacon” A and B. These titles do not show if you are using the less busy “show important text only” but you can get them by clicking on the beacon. They show no color if you’ve set vector symbols in CE to “traditional” and yellow if set to “simplified”. But if you dig into the chart object info for the beacons it describes them as general warning mark colored white. The area marked 1-foot on the raster is shown on the ENC as a dredged channel with “maintained depth” of 4.9 feet. But there’s also that Caution area mark with object detail “shoal area”. Confused yet?
So what C-Map did do with this?
C-Map 1:40,000 scale, dated 1/30/2013 and sourced to NOAA 11541C: If you zoom out enough you see “0” feet between two yellow beacon symbols (in both CE C-Map choices of “American” or “International” symbols). Click on the beacon gets “Beacon Special Purpose, Yellow” in pop-up but if you dig into properties you can find “Top Mark, NW WORDED DANGER SHOAL” though it’s still supposed to be Yellow.
C-Map 1:9,582 scale, dated 2/1/2013, sourced to “XX, Local, Graph, NC019, Non-official Port/Marina Handbook”: same beacon display, but here’s where they show the continuous channel dredged to “4.99 feet”
One last note. I like the way C-Map shows spot sounding in whole feet — instead of those annoying fractional references you see on many vector charts — but it is a little odd they often show one less foot than the NOAA data they are based on.
Ben,
You mentioned that the C-map charts often display 1 ft. less than the NOAA charts they reference. This isn’t a C-map issue in my option, but rather a issue with multiple chart display programs. All of the vector data is stored in meters. The chart display programs convert to feet. Instead of rounding, they truncate. Silly programmers never learned how to round efficiently……..us poor slobs who had to program everything in assembler…even for large mainframes found ways to do it almost as quickly as truncation.
I’ve observed this issue with multiple chart display programs.
Don
I remember that crossing beween channels on the ICW at Beaufort NC in 2004 very well. It was too late when my first mate was able to read the yellow sign. We ran aground. Tow boat US was there in minutes. They do a lot of business there. Garmin’s chart showed the channel but there was a tiny note mark I failed to read. You can see my video story of this event at http://tinyurl.com/ctolnq8
Ben ..
Beaufort NC is my home area. The north Beafort Channel(Gallant Channel) is one of the most confusing areas to navigate. The area adjacent to the ICW changes weekly. We locals im most cases use the NW channel to access to the ICW. There is absoluely no way any of the electronoinc chart vendors can keep up with the chaning conditions, hell, the USCG can’t either
Beaufort North Channel
Tom
Ben,
Small world story….my cousin who lives in Maine read this article….said isn’t that were you live…Back Creek. Yes it is! A neighbor had also called me the night you were anchored there and said “you have to check out the pretty downeast boat anchored in the creek”. He was correct. I own the Ralph Stanley lobsterboat just up from where you anchored. BTW, the line across Back Creek on the chart represents a demarcation line by Division of Marine Fisheries. Everything upstream of the line is a nursery area.
Rick Goode
Thanks for writing, Rick. I remember your handsome boat well. I may have been imagining things but I had it associated with a screened-in cabin that blends nicely with the woods and shore, and possibly a docked sailboat? I figured that someone had worked out a fine way to enjoy that lovely area.
Hi Ben, I have a decent shot of your boat on Back Creek. If you would like it, shoot me an email.
Rick’s neighbor
Thanks, Doug! I just added the photo to the bottom of the entry, and it makes a nice match for my opening picture. I was going very slow with just 2 feet of water under the forefoot (and maybe 1 foot further aft), and I left the anchor hanging for a bit hoping to leave Back Creek with all the mud it had when I arrived 😉 Also glad that I happened to be flying my Maine State flag.