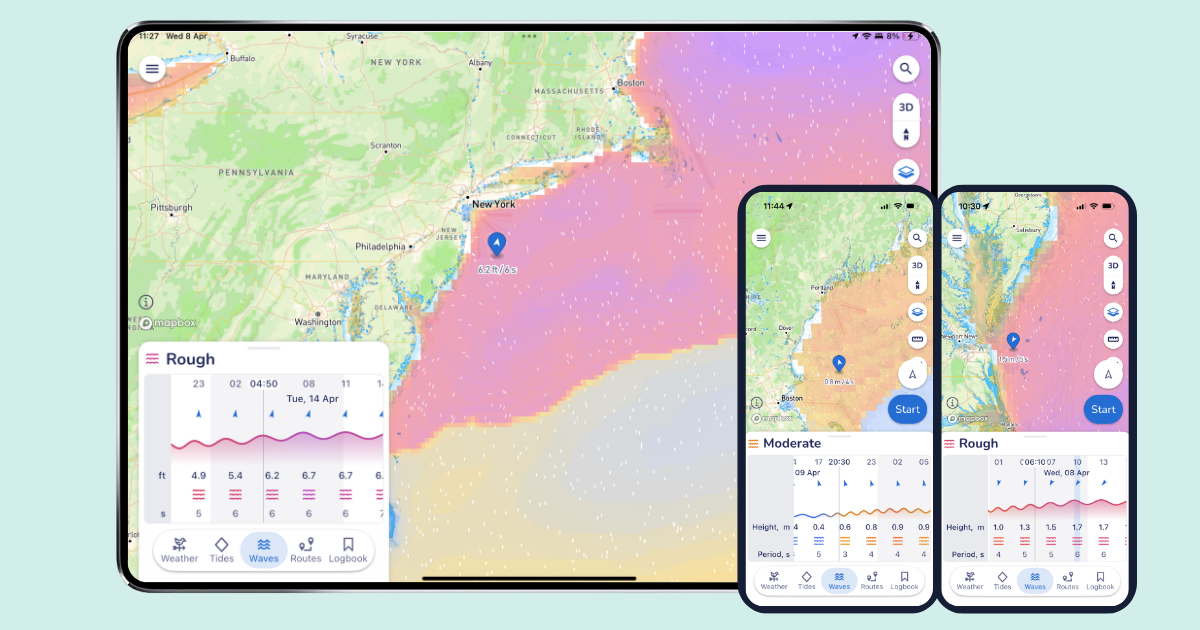
The Raymarine e7 that's been in the Panbo lab for a few weeks is proving itself quite able and well designed, but I've come across enough little glitches and omissions that I think it's also a good test of the new Ray's ability to push out software fixes and improvements. That chart window above, for instance, should be showing
spot soundings. Now it could be that I don't have the chart presentation set up right, but even if that's true, I suspect the menus involved can be improved to help a user like me. On the other hand, that screen shot is from an iPad streaming the e7 over WiFi, and that feature not only works well but continues to intrigue...
It may not matter if you don't cruise outside the U.S., but Coastal Explorer users who do seem quite excited that the PC charting program will soon support the worldwide portfolio of Jeppesen C-Map Max charts and maybe even the older NT+ format. You can hear the enthusiasm, and learn a lot of detail about how the support will work, by checking out this CE Beta testing forum entry. Better yet, if you already run CE 2011, you can download the Beta from the same page and then use its rich chart management features to download some of C-Map's generous demo cartography...
FLIBS was my first chance to see the autorouting capabilities of C-Map 4D in action, and I liked what I saw. And not only is Geonav the first to make the feature available but it's also the first to enable a similar autorouting feature from Navionics (which I wasn't even aware of). As with other "Dual Fuel" chart features, Geonav tried to make the interface on the G12 (and G10) the same so that users switching between C-Map and Navionics cards aren't confused. That's why the details of the menus above and below are the same no matter which type of chart you're using...
Did you ever see the first-in-20-years Bob Dylan interview with Ed Bradley where Dylan expresses astonishment at lyrics he himself once wrote (like It's Alright, Ma), and said he couldn't do it again? A memorable TV moment with a weird and reluctant diety, I thought. My work is absolutely not comparable to Dylan's, but I do sometimes run across a piece written long ago that surprises me in a good way. That happened today with a 2004 PMY column called "Monkey Business" whose catchy subtitle was "Charts separate men from apes, but the path from paper to digital passes through the jungle." I thought I'd republish it with the images that are no longer online, plus links, corrections, and more images. Hope you enjoy...
Nigel Calder and I talked non-stop for about six hours on Friday (and probably could have kept going if we were younger men). He visited because he's working on a new edition of How to Read a Nautical Chart and wanted to check out the latest in electronic charts, particularly the mobile apps. I was happy to help with that, and I also got to ask some questions about Gizmo's systems and find out what's up with his marine hybrid project. I've always liked Nigel's chart book; while it's largely a nice reprint of NOAA's Chart 1 guide to symbology -- no longer published by NOAA, though available for download -- it also includes some terrific history of cartography along with analysis of where it's going electronically. I'll be particularly interested to see what he discovers when visiting the Chart of the Future project at UNH, which is apparently related to a new vector chart standard (interesting S100 PDF here). I was also pleased to learn that Nigel shares my enthusiasm for improving charts with crowd sourcing and even for 3D charting, and he's not a guy who's easily impressed with the latest thing...
It's a lousy photo, for sure, but Jeppesen C-Map has not yet announced its iPad charting app, let alone released screen shots, though I found it one of the nicest surprises of the Miami show. It seems that C-Map not only intends to match Navionics' much appreciated efforts to offer inexpensive but detailed marine cartography on multiple apps platforms, but to do it even better. Note, for instance, the "CWeather" button on the menu bar above, and that C-Map has been working to overlay weather data on plotters since at least 2004 (though the then available mechanisms -- a complicated cellular connection, or a data card transfer -- were awkward). I'm not sure what CWeather offers today (the Jeppesen site says only European data), but we do know that a connected tablet or phone can make the download process very easy.
I sense that PC-based navigation is about to enjoy a renaissance after a long period during which rapidly-advancing MFDs stole its thunder. I can think of several reasons (and you may have more): Decent performance PCs have gotten less expensive and tougher; NMEA 2000 can feed them more data, more easily (thanks in large part to Actisense); the various mobile platforms so many of us want to fool with on board usually relate well to the less mobile platforms that can also work well on many boats; and, finally, MaxSea and Furuno are showing everyone how powerfully a PC can fit into high-end marine electronics systems. One company that will participate in this renaissance, I'm pretty sure, is Fugawi...
I've known of NV Charts for years as a German supplier of cartography for Europe and the Caribbean, but I'd never met founders Cornelia and Hasko Scheidt until this Miami show, and I had no idea that they were expanding into the U.S. with a very interesting model. The Scheidts -- whose perhaps-telling business-card titles are Art Director and Hydrographer -- are creating custom paper charts based on NOAA vector data with their own survey work added, which they also produce in multiple digital forms, though they'd rather you didn't use those without the paper versions on board...
I took a peek at PolarView NS charting software about a year ago, but didn't write about it because I wasn't especially impressed (and there's a certain randomness to what I cover anyway). But times change and software develops, and I'm here to tell you that PolarView 1.5 (video introduction here) is pretty darn impressive. Given its app-like $40 price tag, it's a remarkably powerful program that runs on Windows, Mac OS X, and Linux operating systems. The screen above shows PV running on my little ASUS Eee PC 1000HE 10-Inch netbook
with live NMEA 0183 data coming from the lab's N2K network via a Maretron USB 100. PolarView is quite unusual in that it uses a sister program, called PolarCOM, to do all its data interfacing and instrument displays...
Yet another blizzard is descending on Panbo HQ, and that's excuse enough to further indulge my obsession with local charting, specifically the issue mentioned on Monday about how Northeast Point became an island. It may be a trivial matter, but it does illustrate some technology NOAA is using these days, and perhaps why we should be skeptical about the results. The collage above shows how the Point's shoreline has been depicted on the paper/raster version of chart 13307 for more than a century; the infrared aerial photograph, carefully taken near the time of mean high water, purportedly shows the actual shoreline; and the new vector version of 13307 shows how that recently acquired shoreline data was applied. The trouble is that some rocky reality seems to have been left out of the picture!...