
NOAA introduces Zones of Confidence; mind your ZOC
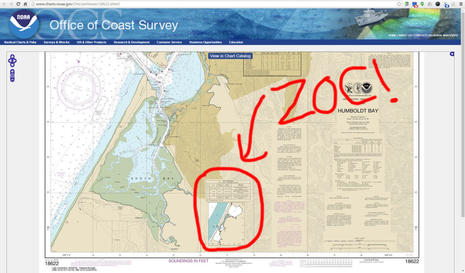
Yikes! Did you know that some areas of the U.S. coastal chart you’re using may only show land and bottom features accurate in position to +/- 1,600 feet, and you shouldn’t be confident about the depth soundings either? NOAA has a new way to show boaters how old and inaccurate much of its survey data is, and it will surely give pause to those who pay attention. The concept is called Zones of Confidence and it’s slowly rolling out as diagrams on paper-style raster charts like the one above, but the ZOC accuracy info is coming much faster to NOAA’s ENC vector charts, and apparently it could be made easily accessible on the commercial vector charts you’re probably using.
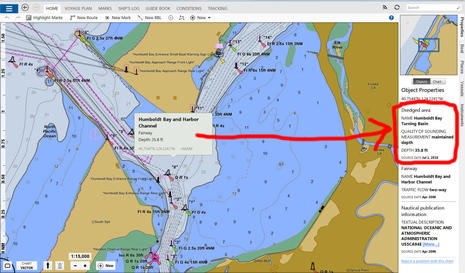
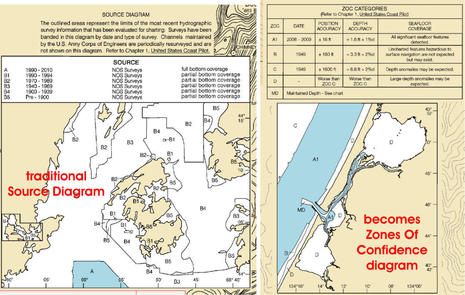 NOAA is replacing the Source Diagram that’s printed (over land) on most detailed charts (usually up to 1:80,000 scale) with a much more informative ZOC diagram in an effort to “help mariners assess hydrographic survey data and the associated level of risk to navigate in a particular area.” Click the image above to better see the Source Diagram for the Penobscot Bay area I cruise compared to the new ZOC on the Humboldt Bay chart (also seen in the opening image and viewable online here). The Source Diagram does suggest how old the survey data is and includes cautions like “partial bottom coverage,” but the ZOC really gets down to the navigation level of risk nitty gritty.
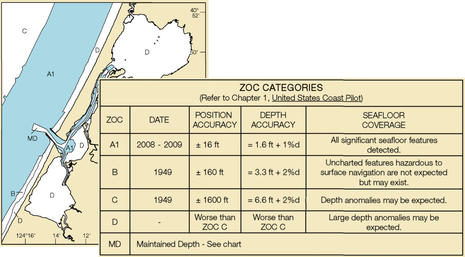 Here’s the Humboldt Bay ZOC collaged so you can better see the disturbing numbers. Substantial areas of the chart were last surveyed at least 67 years ago and NOAA wants us to know that we should have little confidence in its accuracy. In fact, all the zones marked “D” on the chartlet are simply “Worse than ZOC C” which has that +/- 1,600 feet Position Accuracy I mentioned, and ZOC C depth soundings are only accurate to 6.6 feet plus 2% of the depth. Yikes!
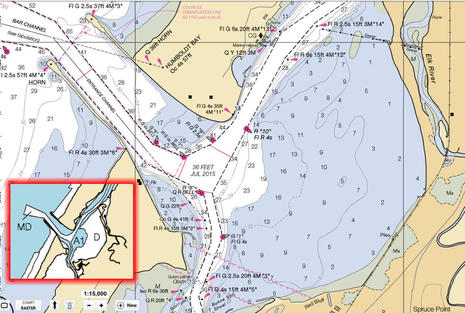 Now let’s see how this plays out on the Humboldt Bay chart itself. All the features and soundings look equally accurate, right? But while the channels are MD (Maintained Depth, i.e. dredged) and the edges of the channels and the bay approaches are thankfully Zone A1 — which means recently surveyed with “+/- 16 ft position | 1.6 ft + 1%d depth accuracy” — that big protected area east of the channels is very low confidence Zone D. And if, say, you just made a first time Humboldt entrance to escape bad weather, doesn’t it look like a possibly good place to anchor for a rest?
Note also that while the Seafloor Coverage for Zone A1 is characterized as “All significant seafloor features detected,” in Zone D “Large depth anomalies may be expected,” and neither Zone B or C has that the “All … detected” confidence level either. Yikes. That NOAA blog entry about ZOCs explains that modern surveys using multibeam sonar can see all bottom anomalies, but the old tools like singlebeam sonars and lead lines were blind to wide swaths of bottom structure, and the surveyors weren’t quite sure where they were anyway 😉
So far NOAA has only issued four paper/raster charts with ZOC diagrams and the rest of the portfolio will only be updated at the new edition rate of about two per month. But, really, how many boaters even knew about Source Diagrams and how many will notice ZOC diagrams when paper charts are going out of use and the quilted raster charts seen on many apps, charting programs and MFDs often don’t display the off-the-water information blocks and diagrams very well?
 But here’s the good news: NOAA is encoding ZOC information into their ENC vector charts and have already “completed Texas to Virginia … and are working our way up the rest of East Coast.” That doesn’t mean we can see it yet in plotters that display ENCs or in the C-Map, Navionics, Garmin, etc. vector charts based on NOAA vectorized data, but all that is quite possible.
Recall that what we see on vector charts is a combination of the underlying data and the device software that processes the data for screen display. And, by golly, NOAA is apparently making it quite possible for vector chart makers to display ZOC info in useful ways. Specifically, Lead Nautical Cartographer Sean Legeer told me:
The ZOC information is encoded as a meta data object called M_QUAL and is a simple polygon. So it should be able to be shaded any way an ECS manufacturer would like. The attribute CATZOC in this object can be used to estimate the accuracy or uncertainty. We also provide the date of surveys.
In fact, long time C-Map manager Ken Cirillo had already told me that they are considering an optional ZOC layer that will shade your actual electronic chart — not a diagram — with the confidence zones and enable pop-ups of the details. So that’s possible. And, heck, it seems possible that a boat wandering out of the A1 Humboldt channel and into Zone D could get a screen warning about how much the chart accuracy is changing. And, by the way, Humboldt Bay is not exceptional given what’s seen on all four of the ZOCed charts and how ZOC accuracy estimates seem to relate to the existing Source Diagrams.
The Coastal Explorer NOAA ENC screen above shows how Rose Point is at least showing the “Quality of Sounding Measurement” and Source Date for a spot in the Humboldt channel, though the ZOC data is not shown well in the Zone D area. (Rose Point, incidentally, is also involved in a NOAA beta test of depth crowdsourcing that seems promising.)
I don’t have a good finishing illustration of what ZOC data can look like in vector form on our plotters, PCs, and apps, but the space below is available. In my experience, most marine cartographers are quite aware that modern electronic charts look more accurate than they really are, so I am hopeful.
PS 1/26/2024: Well, eight years later and I’ve yet to see an effective ZoC presentation on commonly used commercial vector charts. But maybe I missed something readers know about?

At any rate, look what’s possible using the latest ENC presentation on NOAA’s live viewer. When you activate the “Data quality” layer at left, you’ll see starry icons indicating the ZoC grades. The more stars the better the underlying survey data. And with or without the overlay, a point click anywhere on the chart — select point in the “i” tab first — shows more ZoC info for a particular chart section. The “D” in that island area framed in light blue (where many of us like to cruise) means that NOAA has very little confidence in the survey data quality.
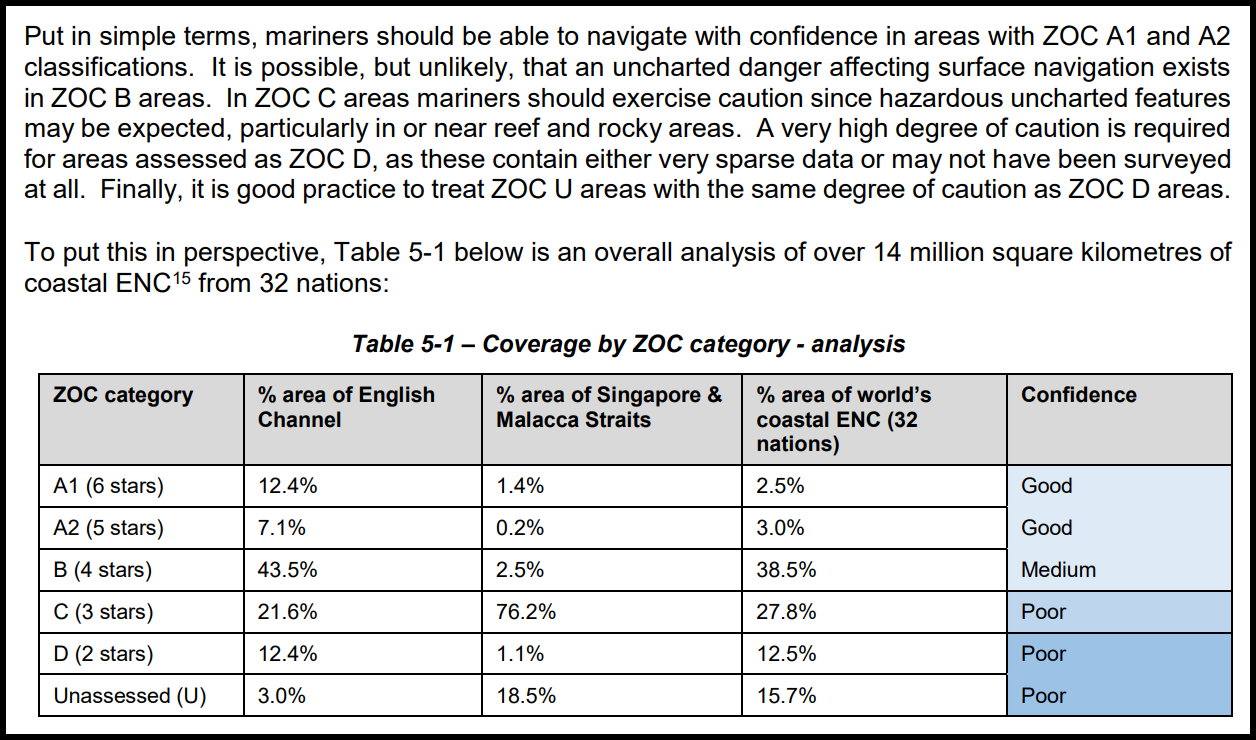
This snip is from the IHO’s Mariner’s Guide to Accuracy of Depth Information in ENC, which is quite worth a read (PDF here). While these cautions are mainly meant for the operators of large commercial vessels, we should all be aware of how poorly much of the coastal oceans have been surveyed. Even the last generation of paper charts were often vaguer about soundings and ledges than they looked, and now ENC can make the same vague data look much more precise.


Nice article Ben.
Do you know how will they handle the areas where they actually dragged a weighted wire? I recall Penobscot had some of those, as a means of finding significant rocks to some control depth.
Will those be (a separate) ZOC, or a different annotation?
Two thoughts. The bay is little more than 1 mile deep from the entrance. Isn’t declaring the accuracy +/- 1600 ft, far far to cautious? With a clear nearby coastline you would think the surveyor knows were they are to within 160 feet. It seems the rating system is too simple, or could use a comment why they choose D.
I went to activeacaptain to jog my memory of the area, and unexpectedly found the ZOC, but only in some views. Need to zoom in and scroll down and to the right of South Bay. If I had not read this Panbo entry, i would not likely have seen the ZOC, and really it was still luck that I noticed it. If you zoom too much or too little it can’t be found. I wonder what can make it more apparent to boaters?
Odd that the S-57 CATZOC description according IHO is slightly different with an A2 zone and also a U zone. I understand USCG and other providers were ‘kindly’ requested by IHO to put some effort into getting these CATZOCs included as soon as possible. IN ENC there are a lot of CATZOC U’s which stands for Unassessed. But for sure it is a good improvement as many navigators believe that when there is a cell or paper chart with a new edition date that all data is also from that date.
Thanks, René! A Google search for “CATZOC” yields many interesting finds. I did not realize how long the international cartography community has been working on how to better inform mariners about data quality. I also enjoyed finding some evidence that commercial and recreational boaters want this information:
http://www.hydro-international.com/content/article/safe-navigation-with-uncertain-hydrographic-data
https://www.iho.int/mtg_docs/com_wg/DIPWG/DIPWG2/TSMAD20_DIPWG2-13A_CATZOC_Symbols_and_Palettes.pdf
The latter is definitely an inter-agency document, but the crucial bit is that 80% of 8,000 mariners polled by NOAA preferred a detailed survey date and CATZOC designation over the current star symbology (which I didn’t know about and haven’t noticed on the vector charts I use).
Here is a map of NOAA’s progress on the new ENC’s https://distribution.charts.noaa.gov/ENC/rescheme/
Thanks, Ted!
I’ll add that David Burch at Starpath just published a primer on using the new ENC’s:
https://www.starpath.com/catalog/books/1999.htm
And he’s also seeing NOAA Custom Charts (NCC) as an improving tool for making ENC-based paper backups:
https://www.starpath.com/NCC/
Finally, for readers possibly confused about what’s going on here, my 2019 lament:
https://panbo.com/noaa-will-sunset-traditional-nautical-charts-sad-but-inevitable/